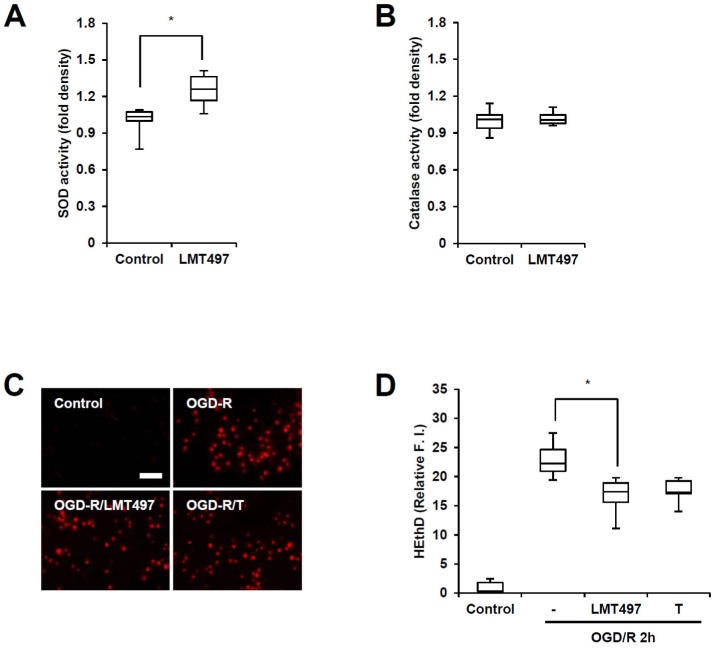
Fig. 4. Effects of LMT497 on SOD/catalase activity and ODG/R-induced superoxide generation. SOD (A) and catalase (B) assays were performed 4 h after incubation with vehicle or LMT497 10 µm. Data are presented as medians±interquartile ranges. n=6; *p<0.05 compared with indicated group (C, D) OGD/R-induced intracellular superoxide levels in cortical cells. Cortical cells were treated with LMT497 (10 µm) Or Trolox (T; 10 µm) before OGD. (C) Representative images. Scale bar=50 µm. (D) Quantification of HE fluorescence. n=6; **p<0.01 significantly different from the control group.
© Exp Neurobiol