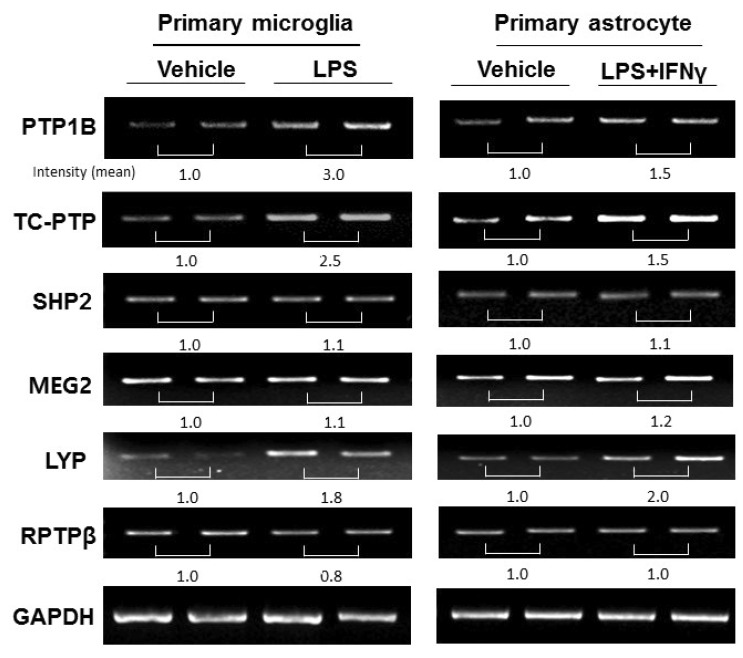
Fig. 2. PTP expression in primary microglia and astrocytes after LPS treatment. The mRNA expression of PTPs in primary microglia and astrocytes 24 h after inflammatory stimulation (LPS treatment (100 ng/ml) for microglia; LPS and IFN-γ (10 U/ml) treatment for astrocytes) were measured using RT-PCR. The quantification of each PTP band intensity is normalized by the band intensity of GAPDH.
© Exp Neurobiol