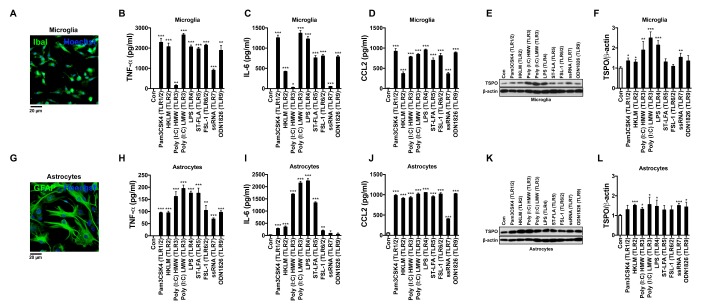
Fig. 1. The comparative analyses of the TLR ligands-induced secretion of pro-inflammatory cytokines and TSPO expression levels in microglia and astrocytes. Immunocytochemistry images of microglia (A) and astrocytes (G). ELISA of TNF-α (B, H), IL-6 (C, I) and CCL2 (D, J) were performed in the supernatants from the microglia and astrocytes 24 h after the TLR ligands stimulation. Immunoblot analysis of TSPO in the lysates of microglia (F) and astrocytes (L). Quantitative analysis of TSPO protein levels was performed after normalization to β-actin. All data are presented as mean±SEM. *p<0.05, **p<0.01 and ***p<0.001 versus control (Con). Immuno blot data are representative of at least three independent experiments.
© Exp Neurobiol