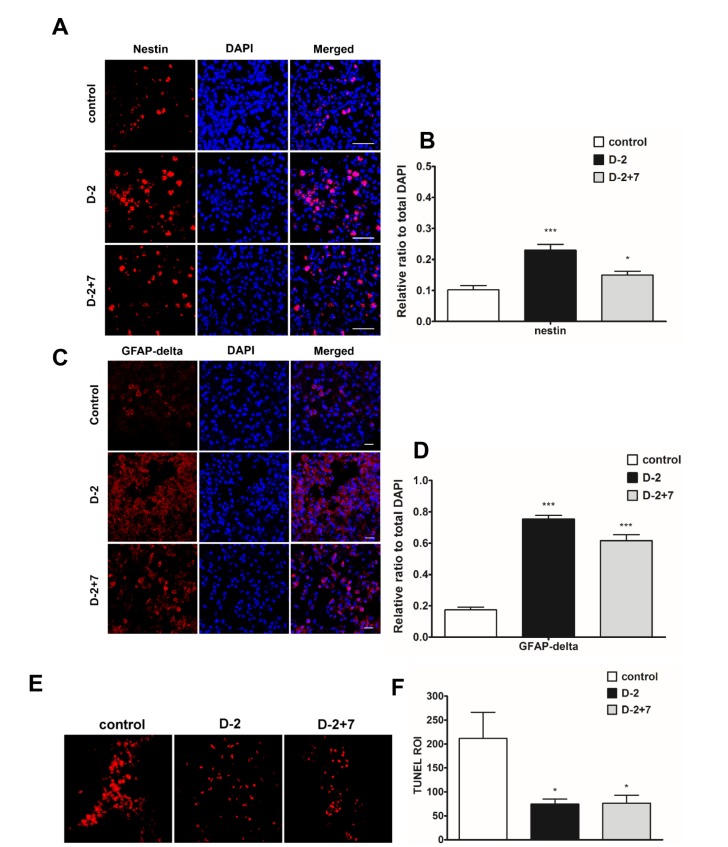
Fig. 3. Neurogenesis in the ischemic brain. (A,B) Immunostaining (A) and quantification (B) of nestin in the IBZ of control, D-2 and D-2+7 groups. (C, D) Immunostaining (C) and quantification (D) of GFAP-delta in the IBZ control, D-2 and D-2+7 groups. Scale bar=50 µm. (E, F) Apoptotic cell death shown by TUNEL assay. *p<0.05, **p<0.01, control, D-2 and D-2+7 groups. Scale bars=20 µm.
© Exp Neurobiol