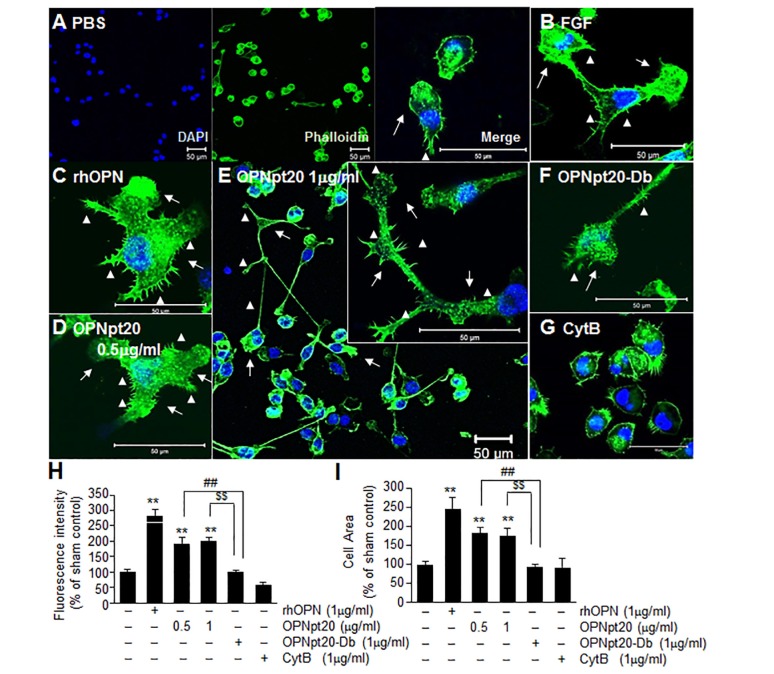
Fig. 2. Induction of F-actin polymerization by OPNpt20. BV2 cells were incubated with FGF (B, 1 µg/ml), rhOPN (C; 1 µg/ml), OPNpt20 (D, E; 0.5 or 1 µg/ml), OPNpt20-Db (F; 1 µg/ml), or CytB (G; 1 µg/ml) for 6 hrs and then immunostained with FITC-labeled phalloidin. Fluorescence intensities (H) and microglial cell areas (I) were measured using Image J software, and results are presented as means±SEMs. Arrows indicate filopodia-like processes and arrowheads indicate lamellipodia-like structures. **p<0.01 versus PBS-treated controls and ##p<0.01, $$p<0.01 between indicated groups. Scale bars represent 50 µm.
© Exp Neurobiol