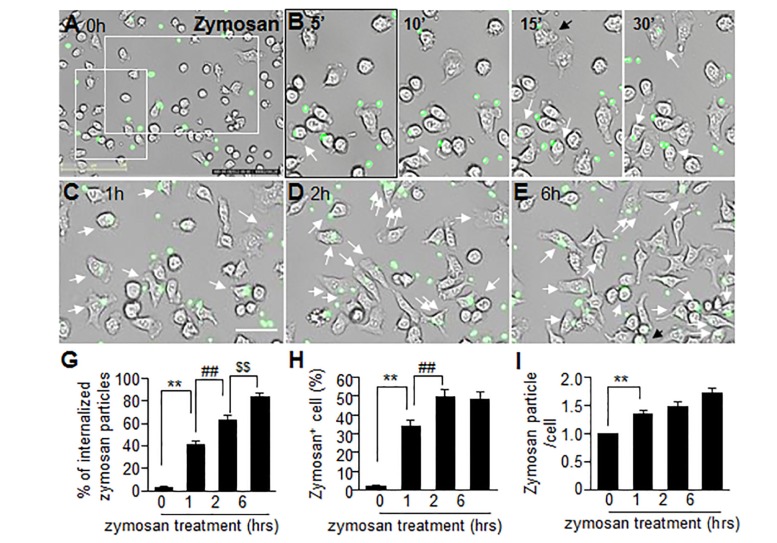
Fig. 5. Phagocytosis of zymosan particles by BV2 cells. BV2 cells were incubated with FITC-labeled zymosan particles and monitored by live cell imaging system for 12 hrs. Phagocytosis of zymosan particles was monitored every 5 minutes for 12 hrs (A~H), and percentages of internalized zymosan particles (I), zymosan positive cells (J), and numbers of zymosan particles per cell (K) were determined by counting 10 photographic fields at 0, 1, 2, 6, and 12 hrs and results are presented as means±SEMs. Arrows indicate internalized zymosan particles. **p<0.05 versus PBS-treated control and ##p<0.01, $$p<0.01 between indicated groups. Scale bars represent 125 µm (A) or 50 µm (B~E).
© Exp Neurobiol