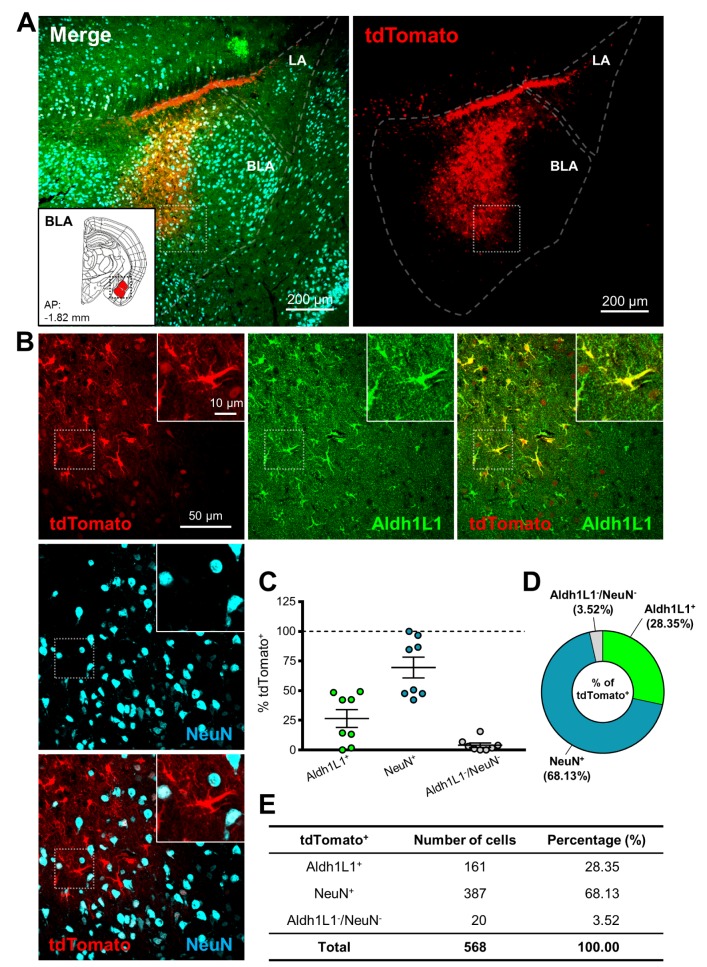
Fig. 3. hALDH1L1 promoter-driven Cre recombinase-mediated tdTomato expression in BLA. (A) Low magnification images of injection area in amygdala. Each color represents as following description. Green indicates immunoreactivity of Aldh1L1 protein; Red indicates tdTomato expression; Cyan indicates immunoreactivity of NeuN. Inset indicates the area of target (red area, BLA). (LA, lateral amygdala). (B) High magnification images from the box in (A). (C) Summary graph of percentages of Aldh1L1+ (green) cells and NeuN+ (cyan) cells (and also both negative cells, gray) in tdTomato+ cells from each image (Mean±SEM). (D) Quantification of tdTomato+ population with Aldh1L1+, NeuN+ and Aldh1L1-/NeuN-cells in thalamic VB area. (E) Summary of tdTomato+ cells in BLA.
© Exp Neurobiol