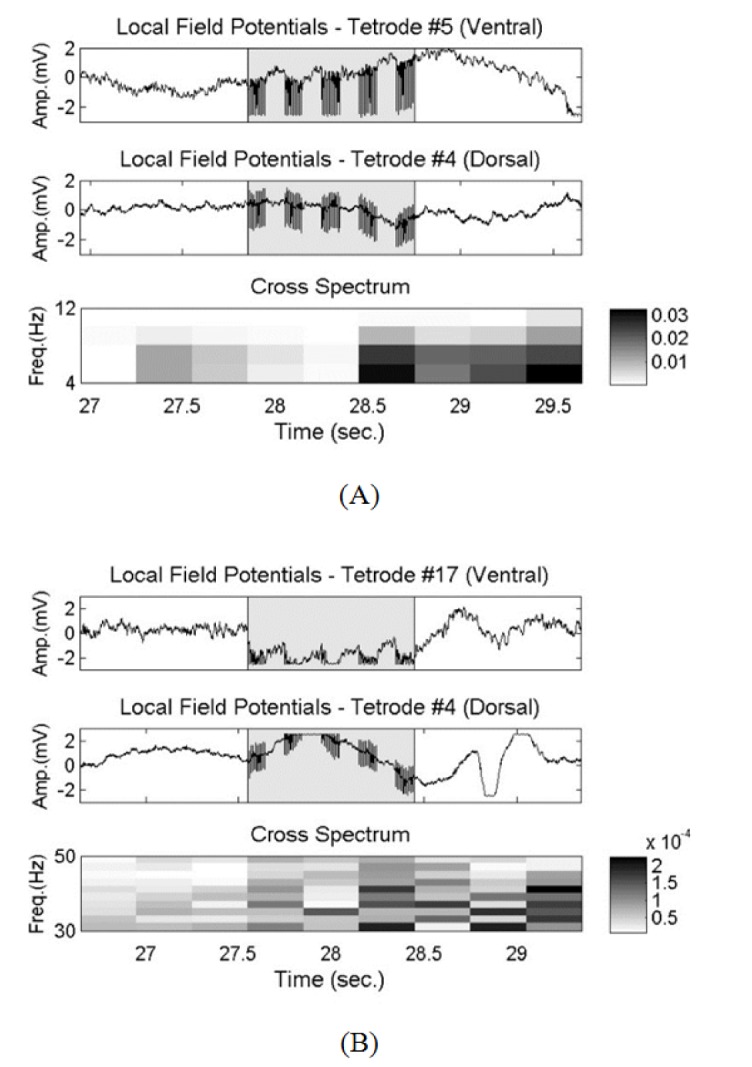
Fig. 9. Local field potentials (LFP) and cross-power spectrum analysis. The grey section in the LFP graph is the stimulus interval. (A) Theta band (above: LFP of the tetrode in ventral hippocampus, middle: LFP of the tetrode in the dorsal hippocampus, below: cross-power spectral density), (B) gamma band.
© Exp Neurobiol