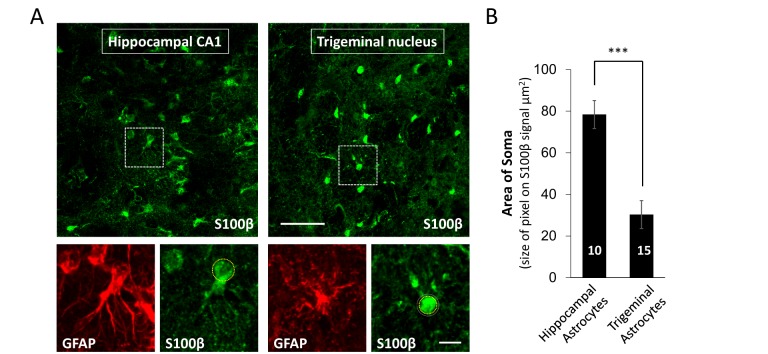
Fig. 2. Comparison of size of soma for astrocytes in hippocampus and trigeminal nucleus. (A) Pictures show result of immunolabeling for GFAP (red) and S100β (green) in hippocampal CA1 and trigeminal nucleus. Upper panel shows low magnification. Lower panel shows high magnification of dotted line box in upper panel. Scale bar indicates 60 µm (upper panel) and 10 µm (lower panel) respectively. (B) Summary bar graph shows area of soma measured pixel size of soma on S100β positive cells in hippocampus and trigeminal astrocyte. ***indicates p<0.001 by student t-test.
© Exp Neurobiol