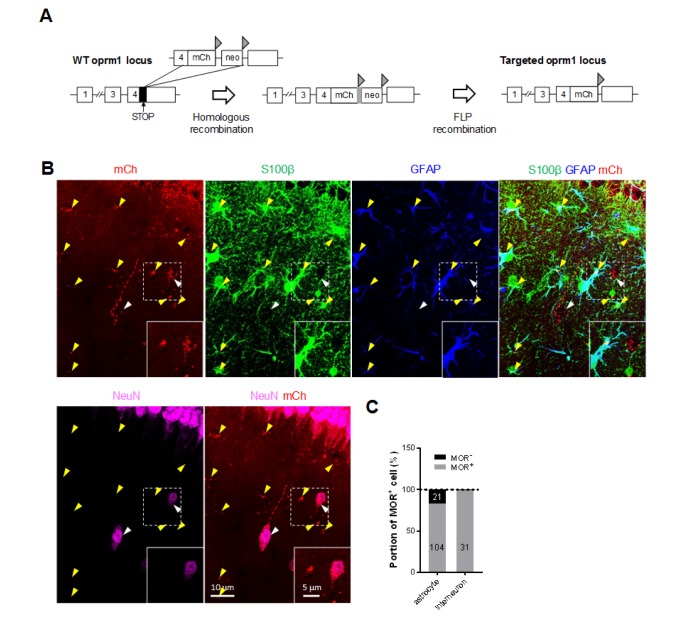
Fig. 1. Expression of MOR in CA1 hippocampal interneurons and astrocytes in MOR-mCherry mice. (A) Genetic background of MOR-mCherry knock-in mouse. Triangle, FRT; mCh, mcherry cDNA; neo, flanked neomycin cassette. (B) Expression of MOR-mCherry signal in GFAP+/S100β+ astrocytes (yellow arrowheads) and NeuN+ interneurons (white arrowheads) in hippocampal CA1 stratum radiatum of MOR-mCherry mouse. (C) Quantification of the portion of MOR+ astrocytes and MOR+ interneurons. Numbers on the bar graph indicate the cell numbers.
© Exp Neurobiol