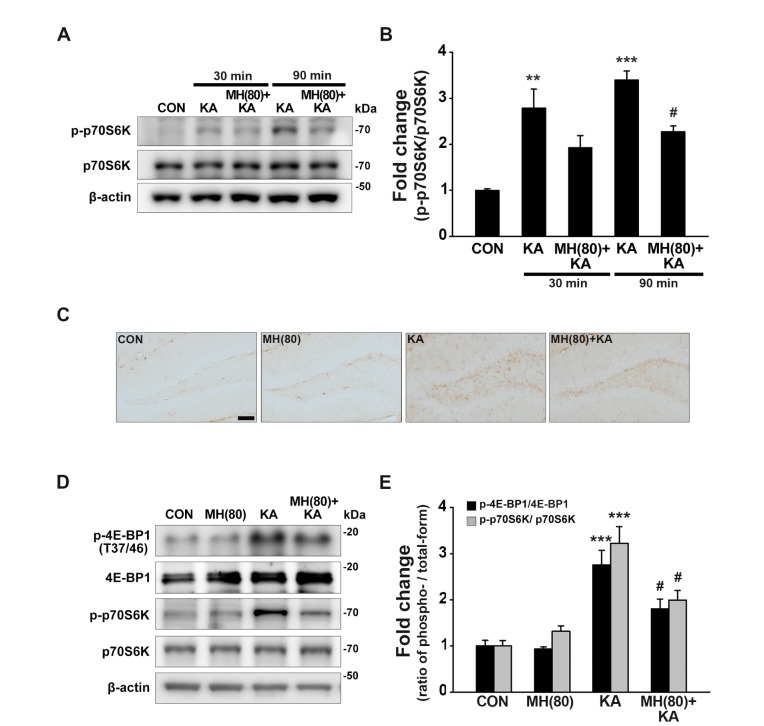
Fig. 3. Morin inhibits mTORC1 activation induced by KA-treatment in the DG. (A, B) Morin was orally administered to mice 1 hour and 1 day before KA injection. (A) Western blot analysis of p-p70S6K, p70S6K, and β-actin expression in the hippocampus 30 min and 90 min after KA treatment. (B) The densities of all bands were normalized to the β-actin bands for each sample. **p<0.01, ***p<0.001 vs. CON, #p<0.05 vs. KA alone (one-way ANOVA and Tukey's post-hoc analysis; n=4 for each experimental group). All values are expressed as the mean±SEM. (C-E) Morin was orally administered to mice one day before KA injection, then administered for two more days, afterwards. (C) Representative coronal sections of the DG following p-4E-BP1 immunostaining 2 days after KA treatment. Scale bar, 100 µm. (D, E) Western blot analysis of p-4E-BP1, 4E-BP1, p-p70S6K, and p70S6K expression in the hippocampus 2 days after KA treatment. (E) The densities of all bands were normalized to the β-actin bands. ***p<0.001 vs. CON, #p<0.05 vs. KA alone (one-way ANOVA and Tukey's post-hoc analysis; n=4 for each experimental group). All values are expressed as the mean±SEM.
© Exp Neurobiol