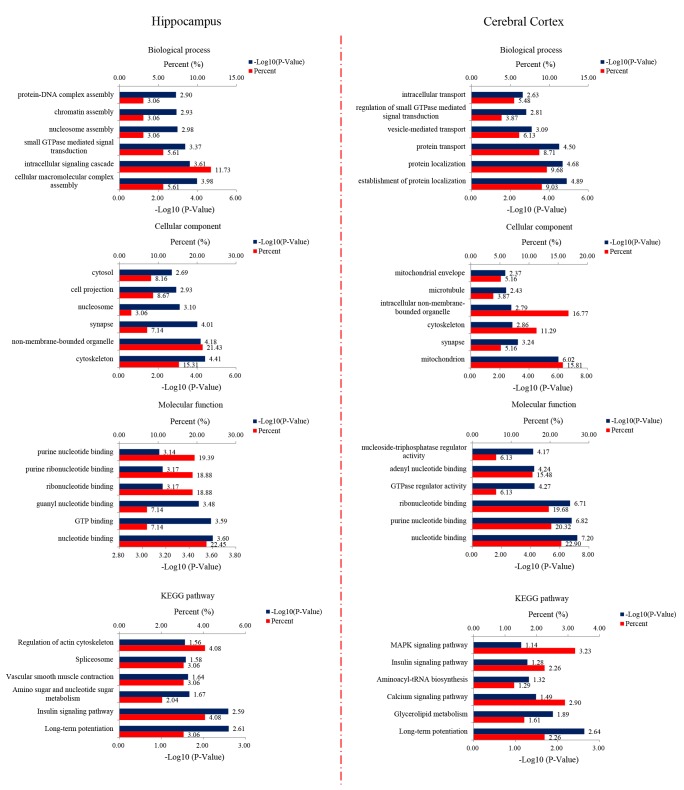
Fig. 6. Bioinformatics analysis of differentially expressed proteins of the hippocampus and the cerebral cortex. 233 and 342 changed proteins in the hippocampus and the cerebral cortex, respectively, were analyzed by DAVID GO analysis and KEGG analysis. Proteins were functionally annotated in according to their biological process, cellular component and molecular function terms, and listed according to the −Log10 (p-value).
© Exp Neurobiol