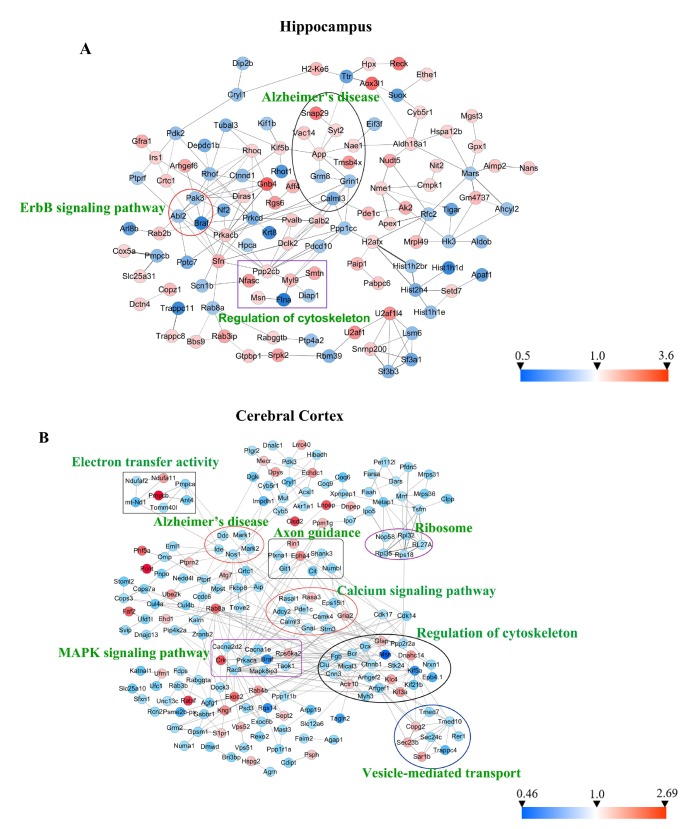
Fig. 7. Protein-protein interaction (PPI) analysis of significantly changed proteins in the hippocampus and the cerebral cortex by using STRING database and mapped by using Cytoscape 3.6.0. (A) PPI network of 233 differentially expressed proteins in the hippocampus. (B) PPI network of 342 differentially expressed proteins in the cerebral cortex. Circles indicate protein, gray lines indicate the interactions between two proteins, red nodes indicate up-regulated proteins, and blue nodes indicate down-regulated proteins.
© Exp Neurobiol