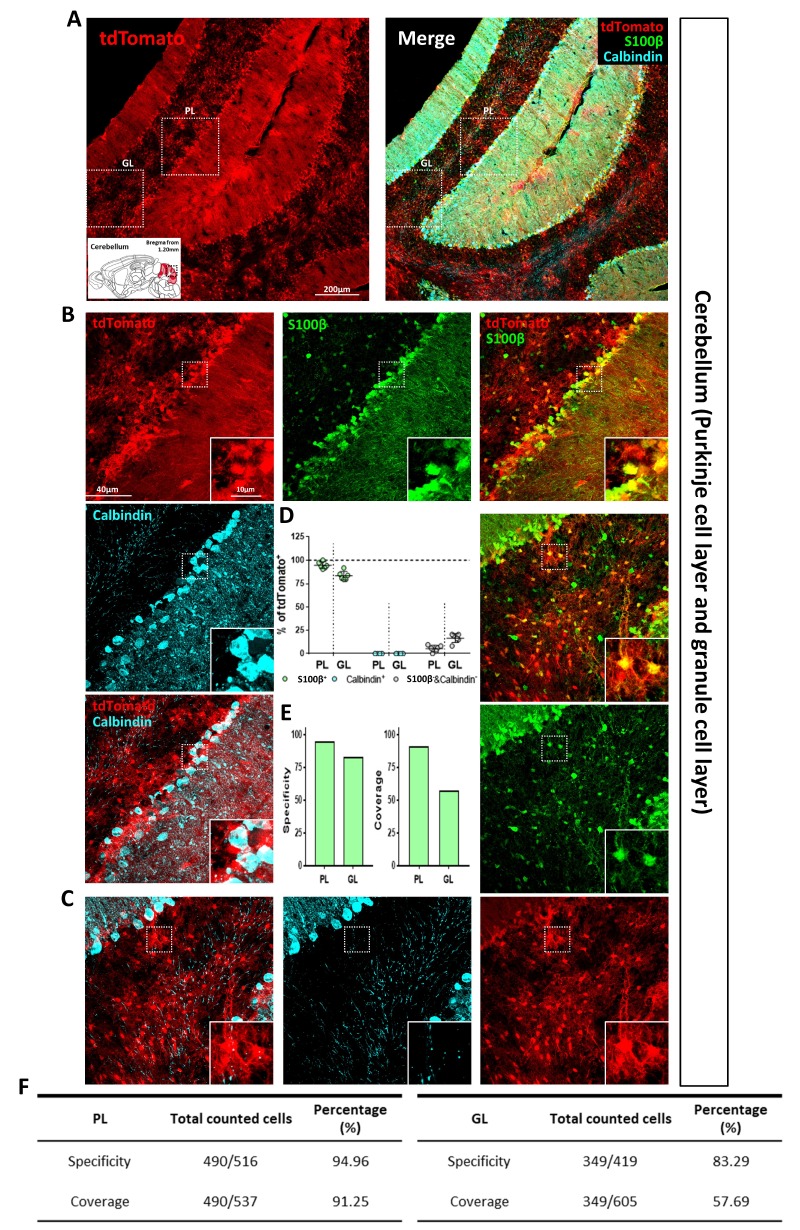
Fig. 7. In cerebellar Purkinje cell layer (PL) and granule cell layer (GL), tdTomato expression driven by hGFAP-CreERT2. (A) Low magnification images of cerebellar PL (left) and GL (right). Each color represents as following description. Green=S100β; Red=tdTomato; Cyan=Calbindin. (B) High magnification images from the box in PL. (C) High magnification images from the box in GL. (D) Quantification of tdTomato+ population with S100β+ (green), Calbindin+ (cyan) and S100β−&Calbindin− (gray) cells in cerebellar PL and GL (Mean±SEM, n=6 sections from 3 mice). (E) Summary graph of astrocyte specificity (tdTomato+&S100β+/tdTomato+) and coverage (tdTomato+&S100β+/S100β+) from each region. (F) Summary table of above analysis (PL: left, GL: right).
© Exp Neurobiol