Download original image
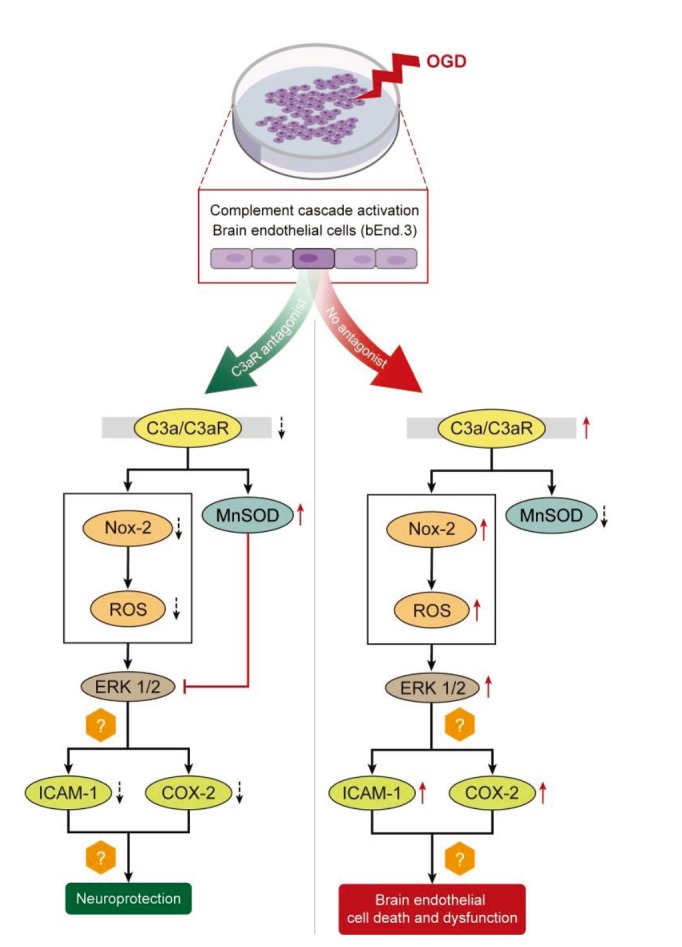
Fig. 8.
Schematic diagram showing OGD induced vascular dysfunction and the protective role of C3aRA. Solid arrow showing increase and broken arrow showing decrease. OGD, oxygen glucose deprivation.
Exp Neurobiol 2019;28:216~228
https://doi.org/10.5607/en.2019.28.2.216
© Exp Neurobiol
© 2019.
The Korean Society for Brain and Neural Sciences
. / Powered by
INFOrang Co., Ltd