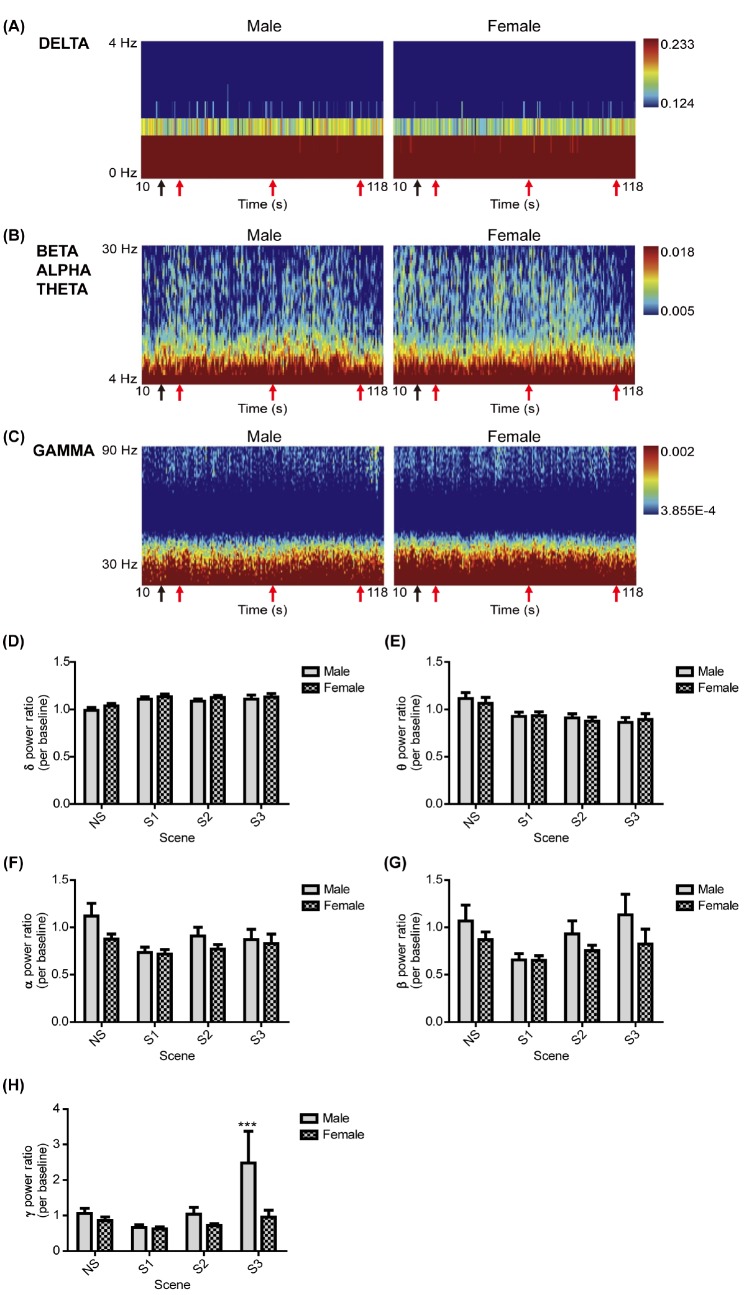
Fig. 2. Comparisons of EEGs in the Fp2 channel between genders. (A), (B), and (C) represent the power spectrum across time (10~118 s) and frequency intervals, the δ (0~4 Hz), θ-α-β (4~8 Hz, 8~13 Hz, 13~30 Hz) signal, and γ signal (30~90 Hz) in the Fp2 channel, respectively, according to gender. At the bottom of each panel, the first black arrow represents the start of the NS (19 s); the second, third, and fourth red arrows represent the start of scene 1, scene 2, and scene 3 (S1, 28 s; S2, 70 s; S3, 108 s), respectively. (D~H) represent the power ratios of the δ, θ, α, β, and γ signals in the Fp2 channel, respectively, in response to the NS and aggression scenes, between sexes. All values are represented as the mean±SEM. The sample size for EEG measurement was 84 individuals, of whom 36 were men and 48 were women. None of the values was significantly different between genders, as determined by the two-tailed independent t-test. The symbol *** above the graph bar indicates statistically significant differences between the NS and the aggression scenes (S1 or S2 or S3) at p<0.001 according to the two-way ANOVA.
© Exp Neurobiol