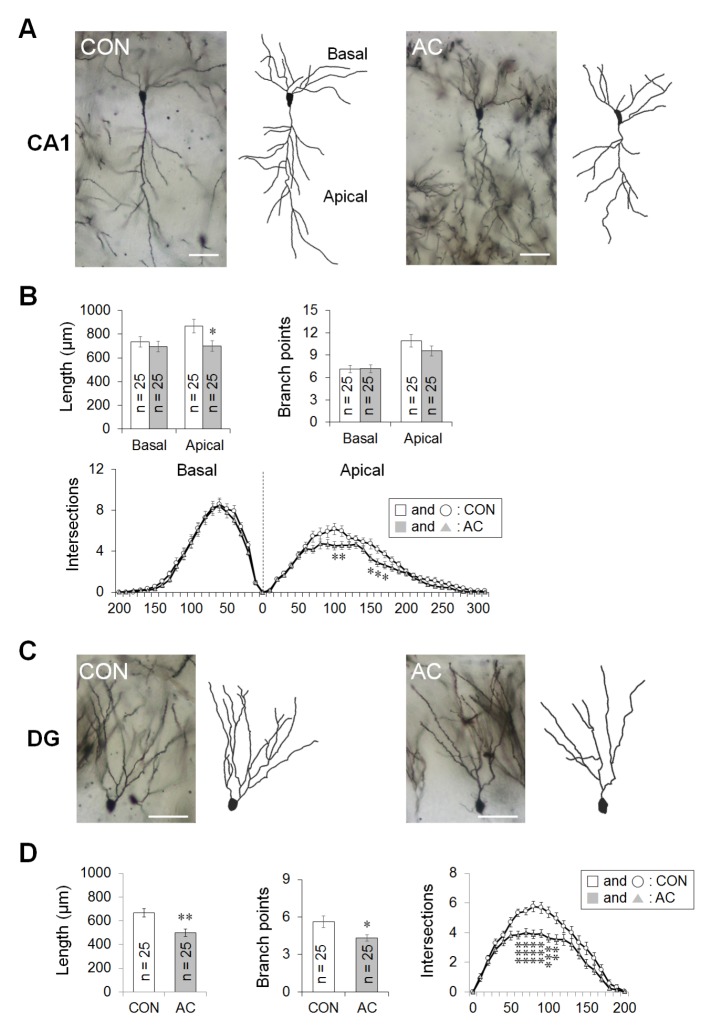
Fig. 4. AC affected dendritic complexity in the CA1 pyramidal cells and DG granule cells. Golgi staining of brains from vehicle- or AC-treated mice revealed consistent differences. (A) CA1 pyramidal cells. (B) Bar graphs (left and right) showed the mean total dendritic length and dendritic branch points, respectively. Line graphs (lower) showed the mean number of intersections per 10-µm radial unit distance from the soma (0) for basal (left) and apical (right) dendrites, indicating that AC reduced total dendritic complexity in the hippocampal CA1 area. (C) DG granule cells. (D) Bar graphs (left and middle) showed the mean total dendritic length and dendritic branch points, respectively. Line graphs (right) showed the mean number of intersections per 10-µm radial unit distance from the soma (0) for dendrites, indicating that AC reduced the total dendritic length and complexity in the DG granule cells. Data are expressed as means±SEs. *p<0.05, **p<0.01, and ***p<0.001 vs. vehicle-treated controls. Scale bars in (A) and (C) represent 60 µm.
© Exp Neurobiol