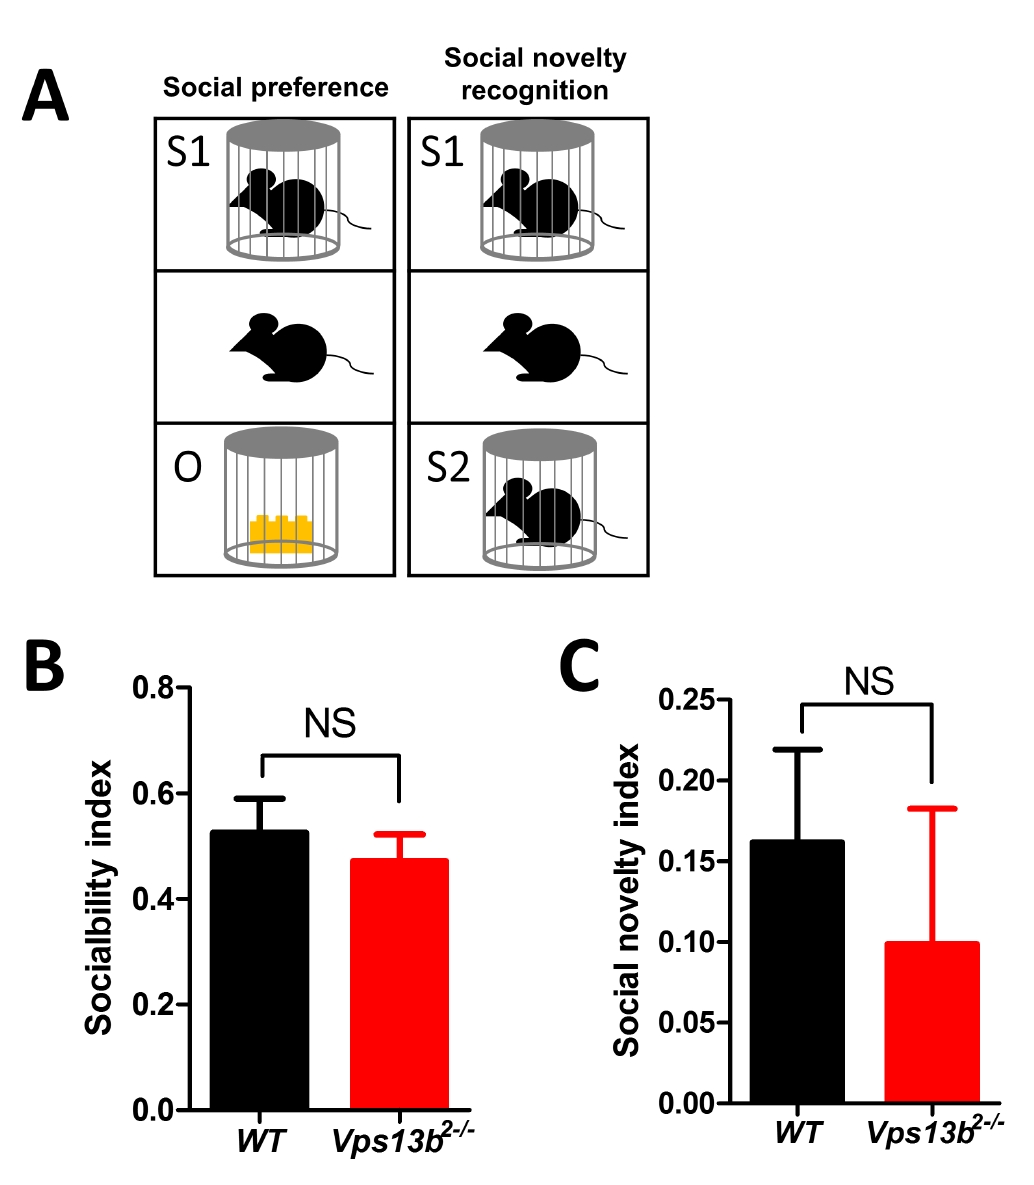
Fig. 4. Normal social behavior in Vps13b2−/− mouse. (A) Schematics for social preference and social novelty recognition test in three-chamber test. (B) Sociability index was calculated by [Time spent interacting with object-stranger 1]/[Time spent interacting with object+stranger 1] (WT: 0.53±0.06, n=9 mice; Vps13b2−/−: 0.47±0.05, n=12 mice; unpaired t-test, p=0.516). (C) Sociability novelty index was calculated by [Time spent interacting with stranger 1-stranger 2]/[Time spent interacting with stranger 1+stranger 2] (WT: 0.16±0.06, n=9 mice; Vps13b2−/−: 0.10±0.08, n=12 mice; unpaired t-test, p=0.571). NS, not significant. All data shown are mean±SEM.
© Exp Neurobiol