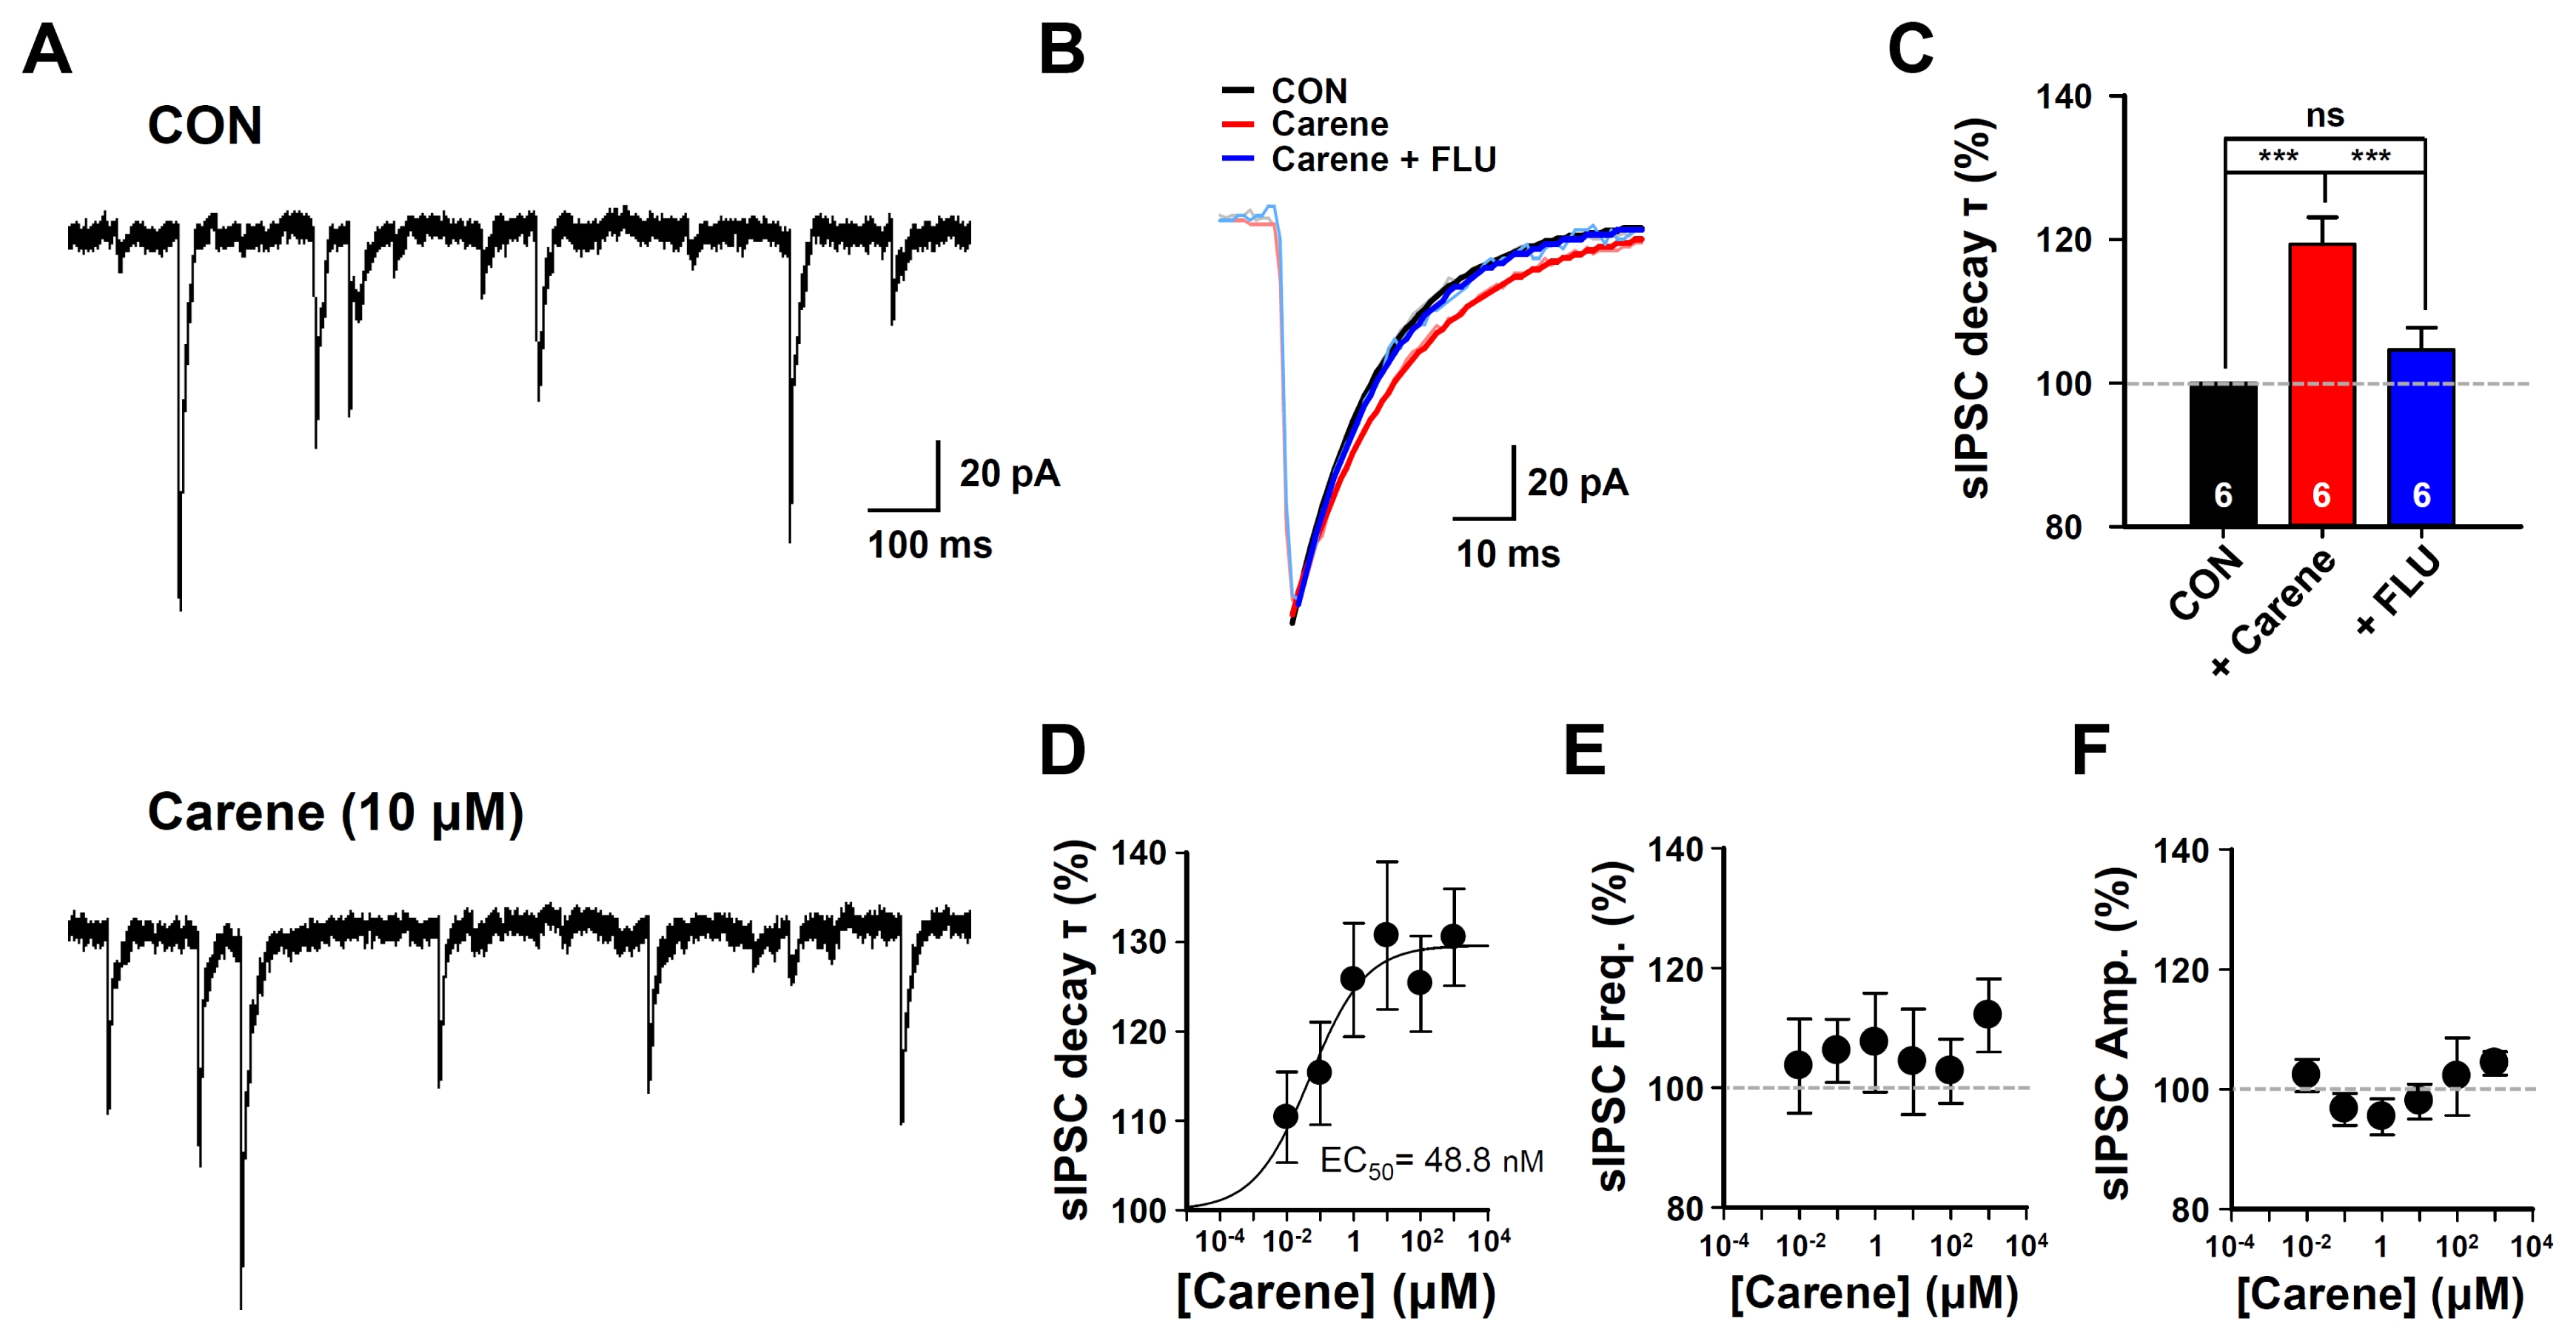
Fig. 4. (A) Representative traces of sIPSC before (CON) and after treatment of 3-carene (10 μM). (B) Averaged sIPSCs after normalization by peak. (C) Summary bar graph of sIPSC decay value before and after treatment of 3-carene and flumazenil (1 μM, right). ***p<0.001, significant as compared to the control group (One-way ANOVA, Dunnett’s test). (D~F). Summary graphs of sIPSC decay tau value (D), frequency (E), and amplitude (F) after normalization by control response. Decay response was fitted using sigmoidal logistic 4 parameters.
© Exp Neurobiol