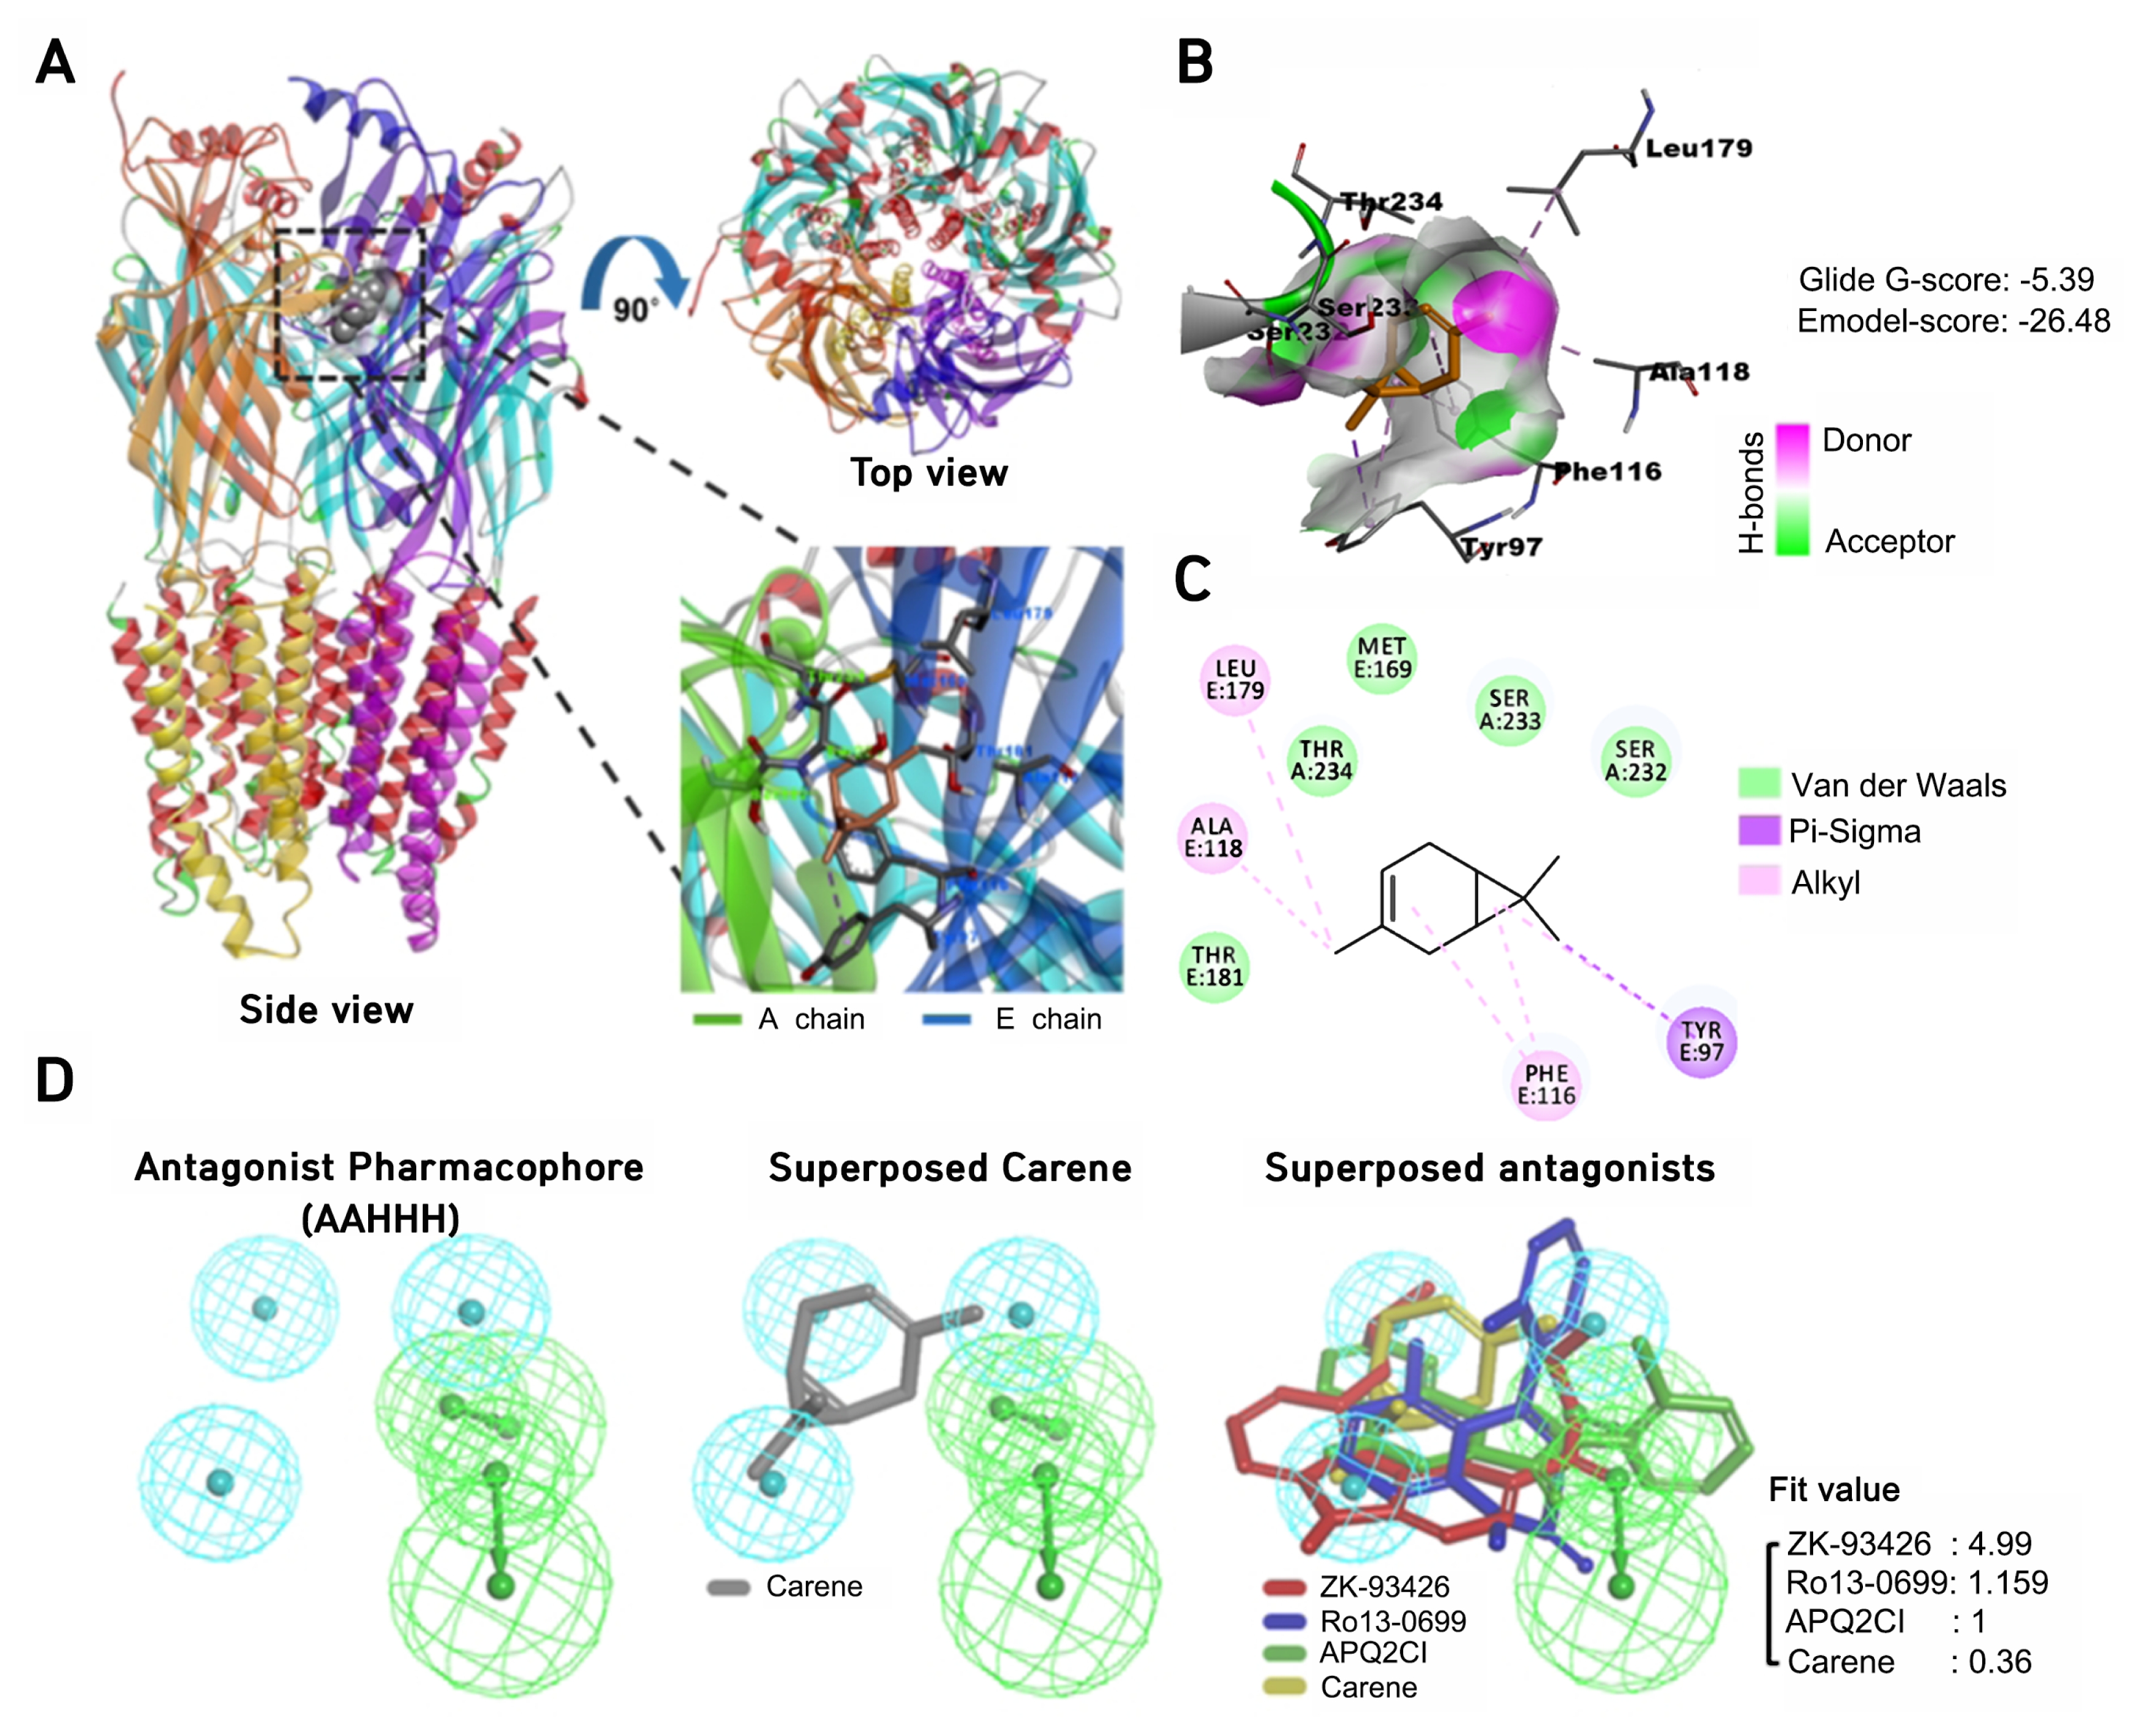
Fig. 5. (A) GABAAR shown by different chain colors. 3-carene (gray sphere) docked inside chain A and chain B (left). (B) Closer view of docked model of 3-carene, interacting residues was shown by lines and 3-carene by stick model (upper). 2D-interaction plot of 3-carene and surrounding residues of GABAA receptor. (C) Various interactions were represented by distinct color and dashed lines. α1- and γ2-subunit of GABAA receptor is shown by A and E chains, respectively. Protein shown by transparent hydrogen bond donor and acceptor surface. Pink and Violet showed Pi-alkyl and pi-sigma interactions. (D) 3-carene mapped over antagonist pharmacophore. Hydrophobic and hydrogen bond acceptor features shown in cyan and green mesh sphere (left, middle). Hydrophobic and hydrogen-bond acceptor features were depicted by cyan and green mesh spheres. ZK-93426, Ro13-0699, APQ2Cl and 3-carene were shown by the red, blue, green and yellow sticks, respectively (right).
© Exp Neurobiol