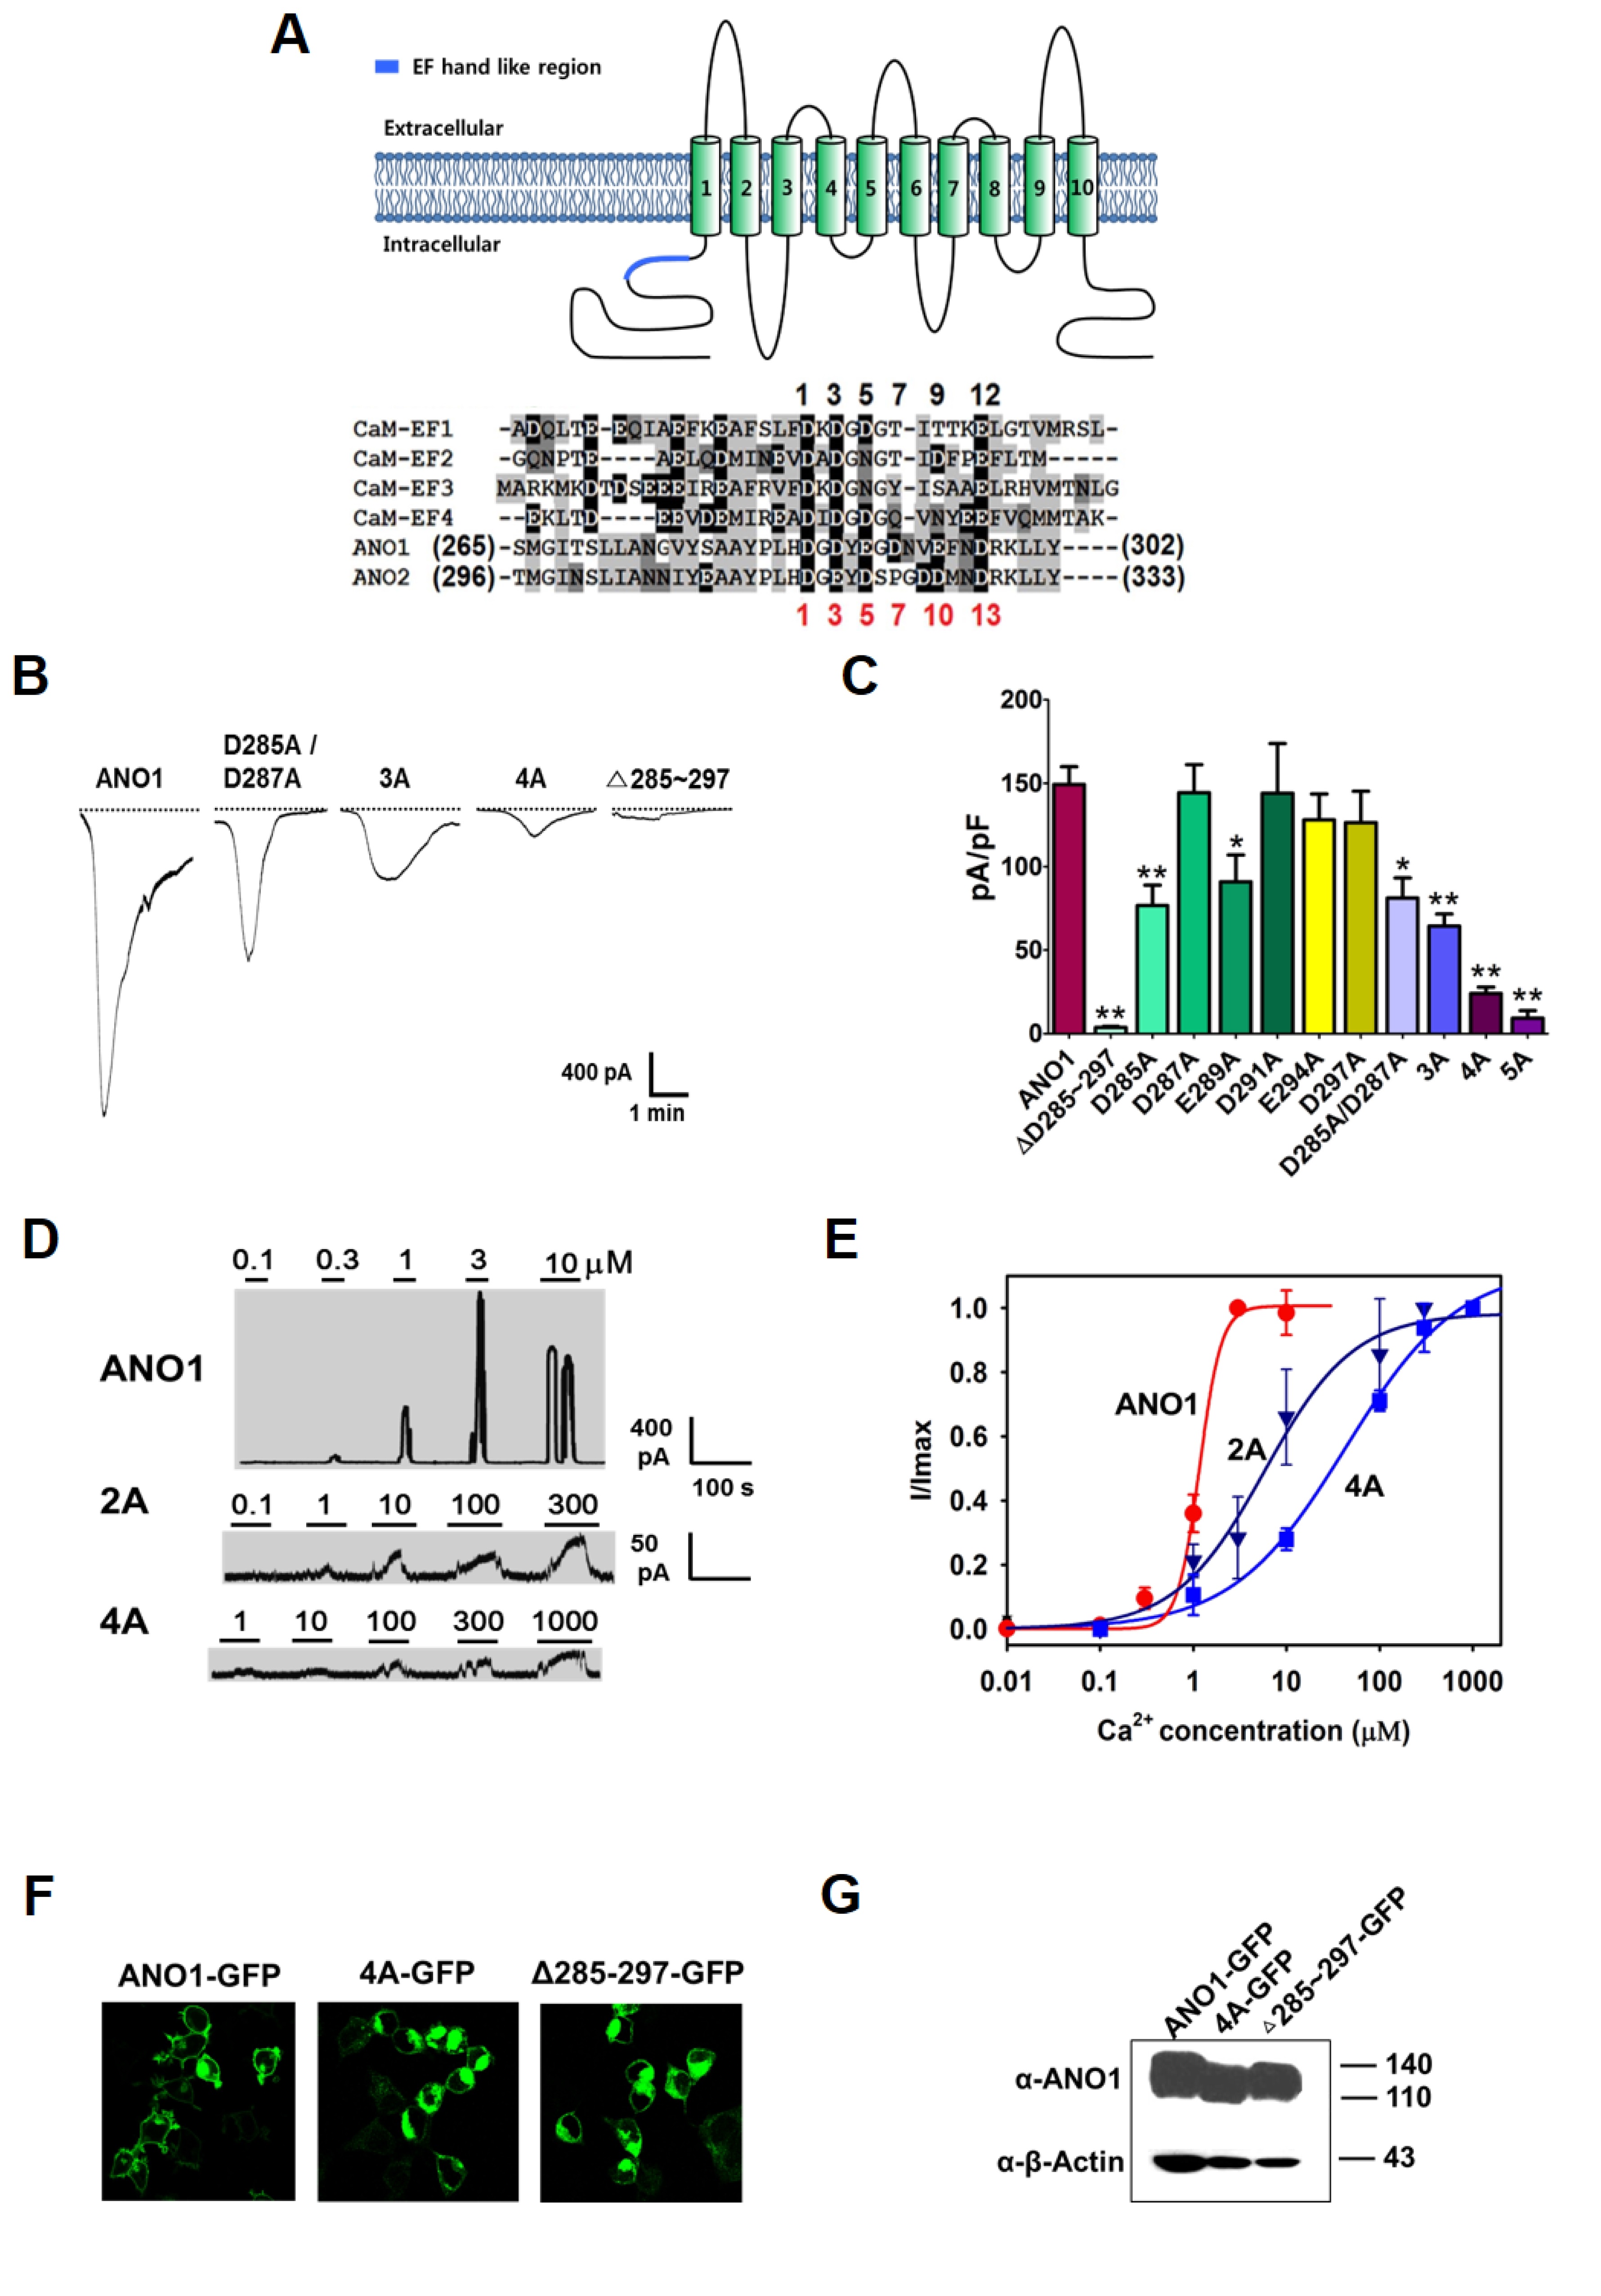
Fig. 1. Mutation of the EF-hand like region of ANO1 alters Ca2+ sensitivity. (A) Putative Ca2+ modulation sites in ANO1 and ANO2: the EF-hand like region in the N-terminus. The sequence alignment displays similarity between EF-hand loops of calmodulin and the EF-hand like regions in ANO1 and ANO2. (B) Whole cell currents of ANO1 and EF-hand like region mutants activated by [Ca2+ ]i in HEK cells transfected with ANO1 and mutant genes. Whole-cell currents were elicited using a 10 μM Ca2+ pipette solution at a holding potential of −60 mV. Pipette and bath solutions contained 140 mM NMDG-Cl. The dashed line represents the baseline. 3A; D285A/D287A/E289A mutant, 4A; D285A/D287A/E289A/D291A (AGAYAGA) mutant. (C) Summarized whole cell currents of ANO1 and EF-hand like region mutants (n=5~16). **p<0.01 compared to ANO1 (ANOVA, Tukey’s post-hoc test). Error bars represent SEMs. 5A; D285A/D287A/E289A/D291A/E294A mutant. (D) Representative traces of single-channel currents of wild-type ANO1 and its mutants activated by various concentrations of Ca2+. Ca2+ was applied to the bath of inside-out patches isolated from HEK cells expressing ANO1 and its 2A (D285A/D287A) or 4A mutant at different concentrations. The holding potential was +80 mV. (E) Dose-response relationship of ANO1 (●) and of its 2A (▼) and 4A (■) EF-hand like region mutants. Plots of single-channel currents at each [Ca2+]i concentration (from 0.01 to 1,000 μM) were fitted to Hill’s equation (n=5~12). Ehold=+80 mV. ANO1, EC50=1.0 μM (Hill’s coefficient (nh)=3.7); 2A, EC50=5.8 μM (nh=0.9); 4A, EC50=41.8 μM (nh=0.6). (F) Localization of wild type ANO1 and mutants in HEK cells. GFP-tagged wild type ANO1, 4A and Δ285–297 mutants are normally observed in the plasma membrane. (G) Western blot analysis of mutant ANO1s. HEK cells transfected with wild type ANO1 were used as positive control.
© Exp Neurobiol