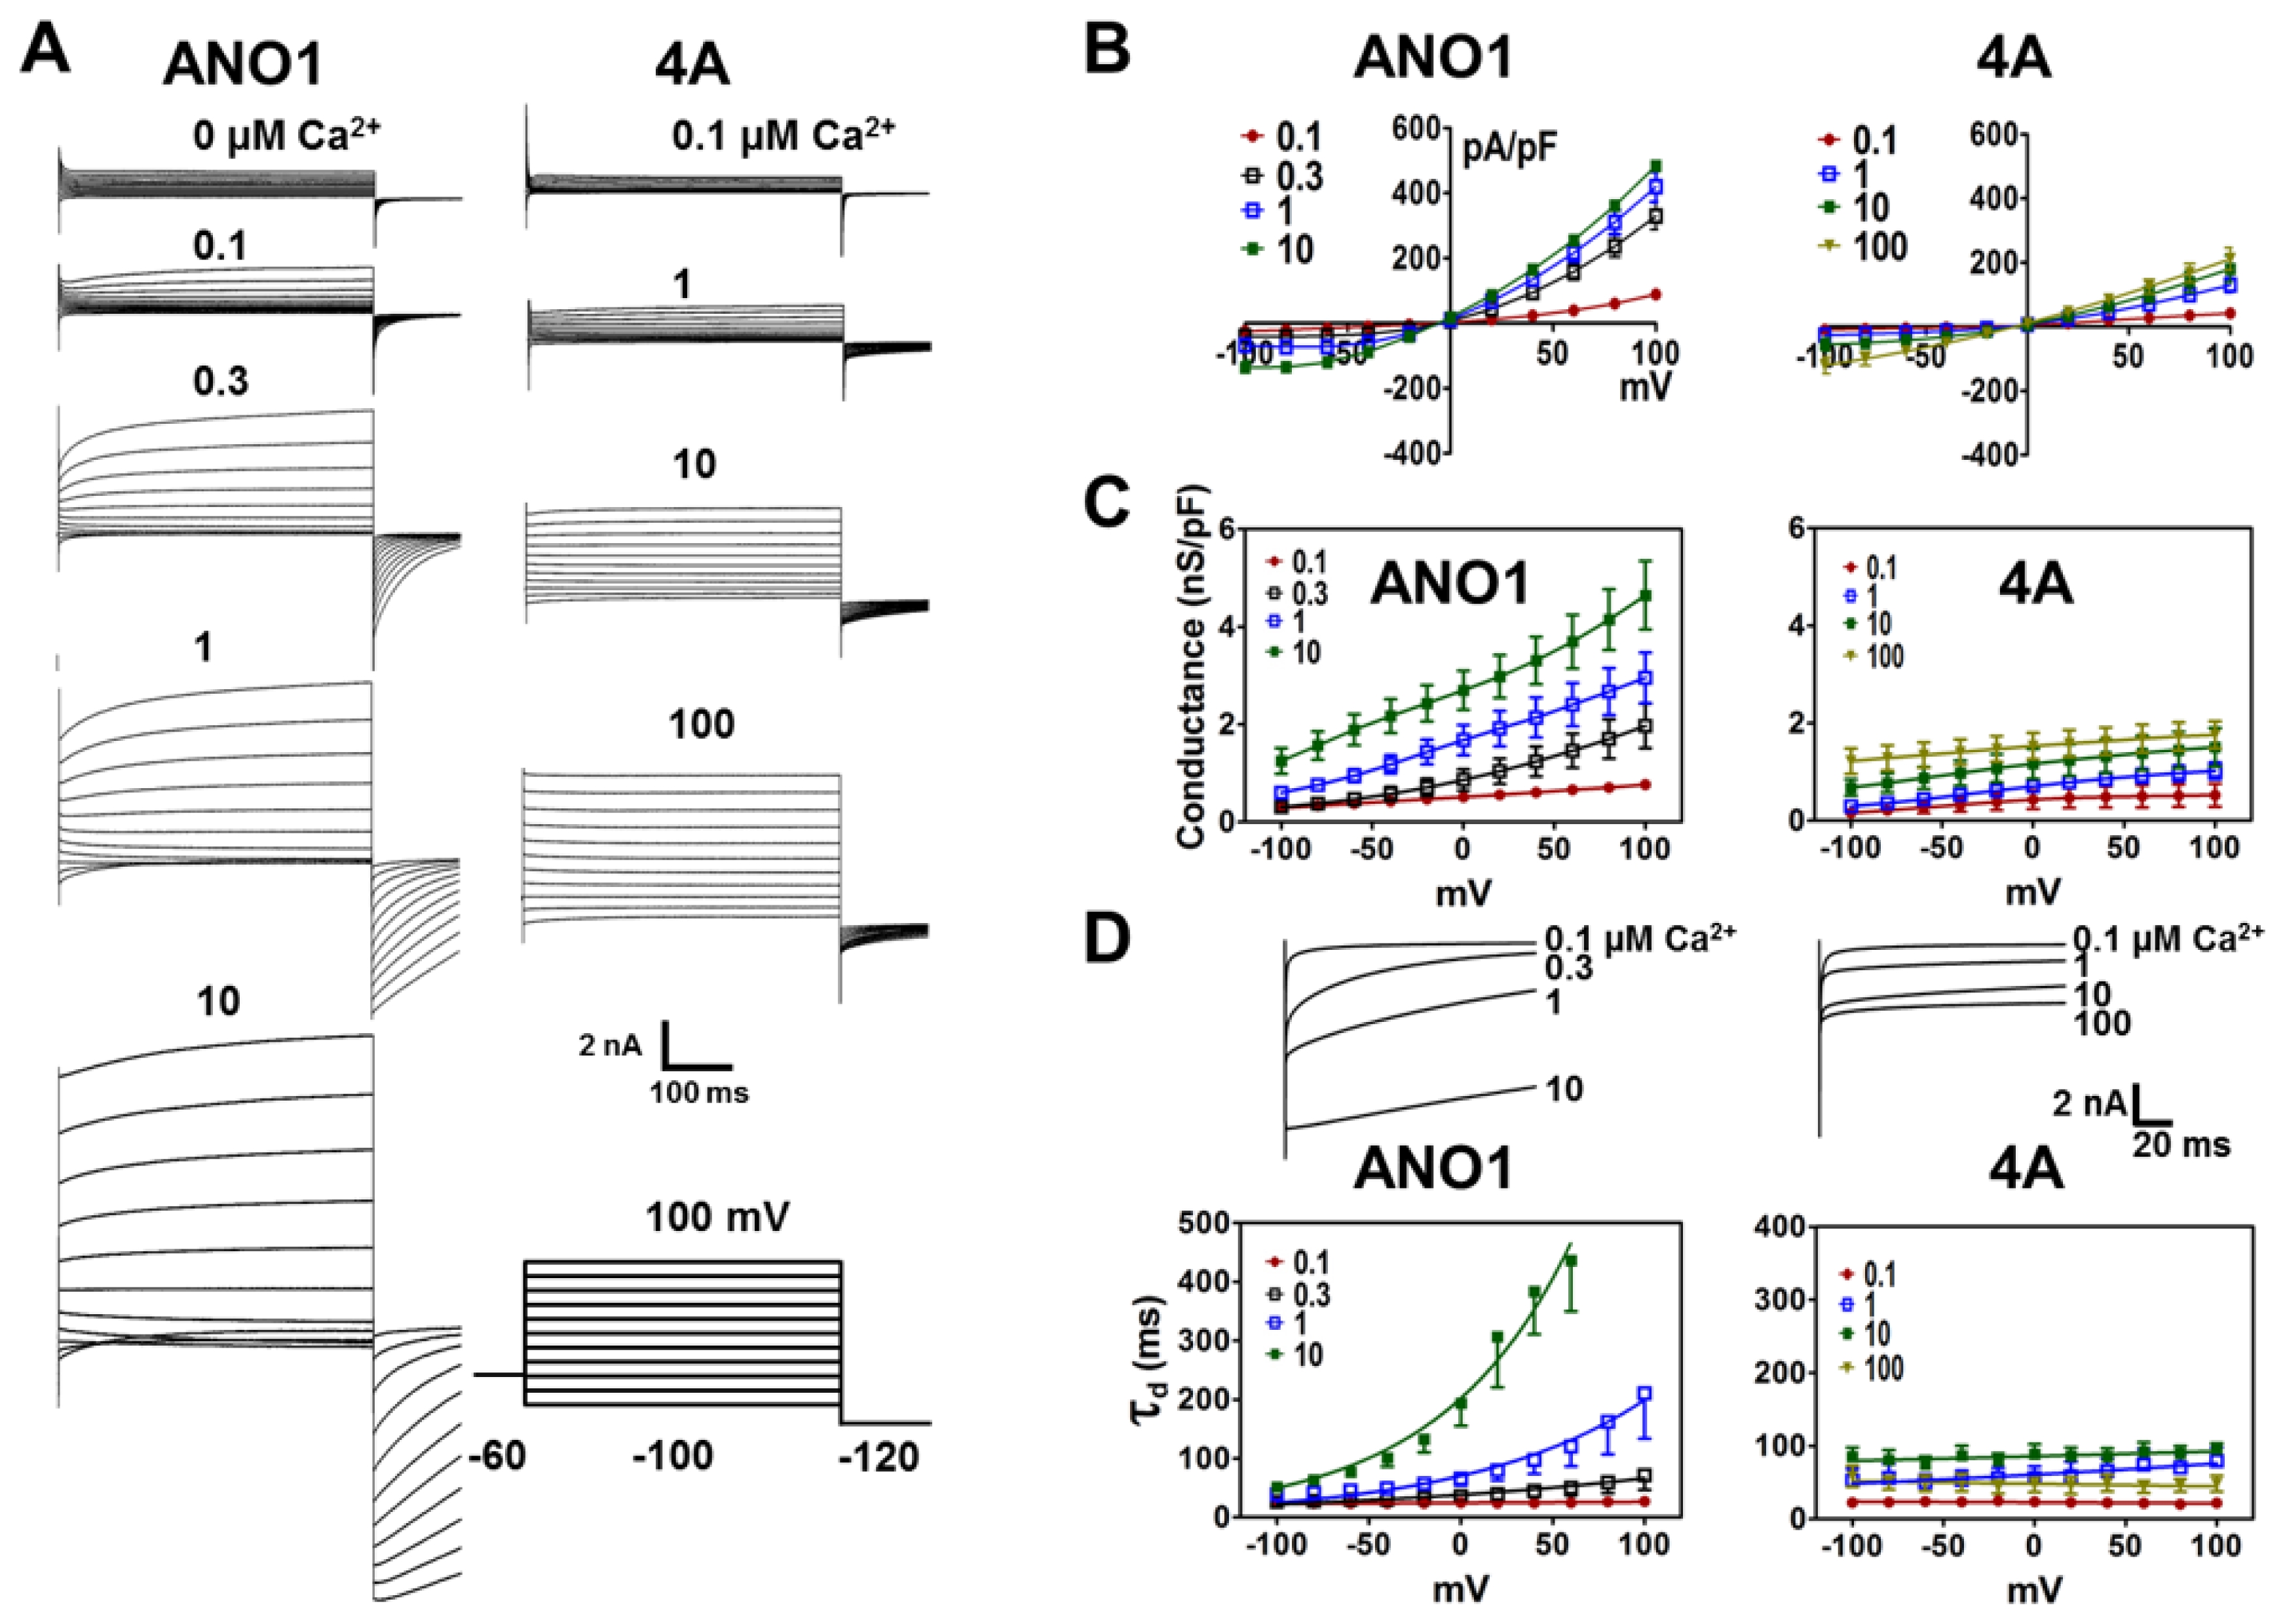
Fig. 2. Mutation in the EF-hand like region alters ANO1 characteristic responses to voltage steps. (A) Slow activation of outward currents at depolarization by low [Ca2+]i and slow-decaying tail currents of ANO1 at high [Ca2+]i (left panel) were almost absent in the 4A mutant (right panel). Whole-cell currents of ANO1 and its 4A mutant were recorded using a step voltage protocol (lower panel, from −100 to 100 mV in 20 mV increments, 500 ms per step) at [Ca2+]i levels of from 0 to 10 μM for ANO1 and from 0.1 to 100 μM for 4A mutant. Tail currents were recorded at −120 mV over 150 ms. (B) Current-voltage relationships of ANO1 (left panel) and 4A mutant (right panel). Data were taken from currents at the end of each voltage step (n=5). (C) The conductance-voltage relationships of tail currents (n=5). Conductances were determined by measuring instantaneous tail currents at −120 mV after various voltage pulses. (D) The upper panel displays average tail currents of ANO1 (left panel) and 4A mutant (right panel) (n=5~6). The lower panel displays deactivation time constants obtained from the tail currents shown in the upper panel. Deactivation time constants (τd) were obtained using single exponential fits to tail currents recorded at −120 mV.
© Exp Neurobiol