Download original image
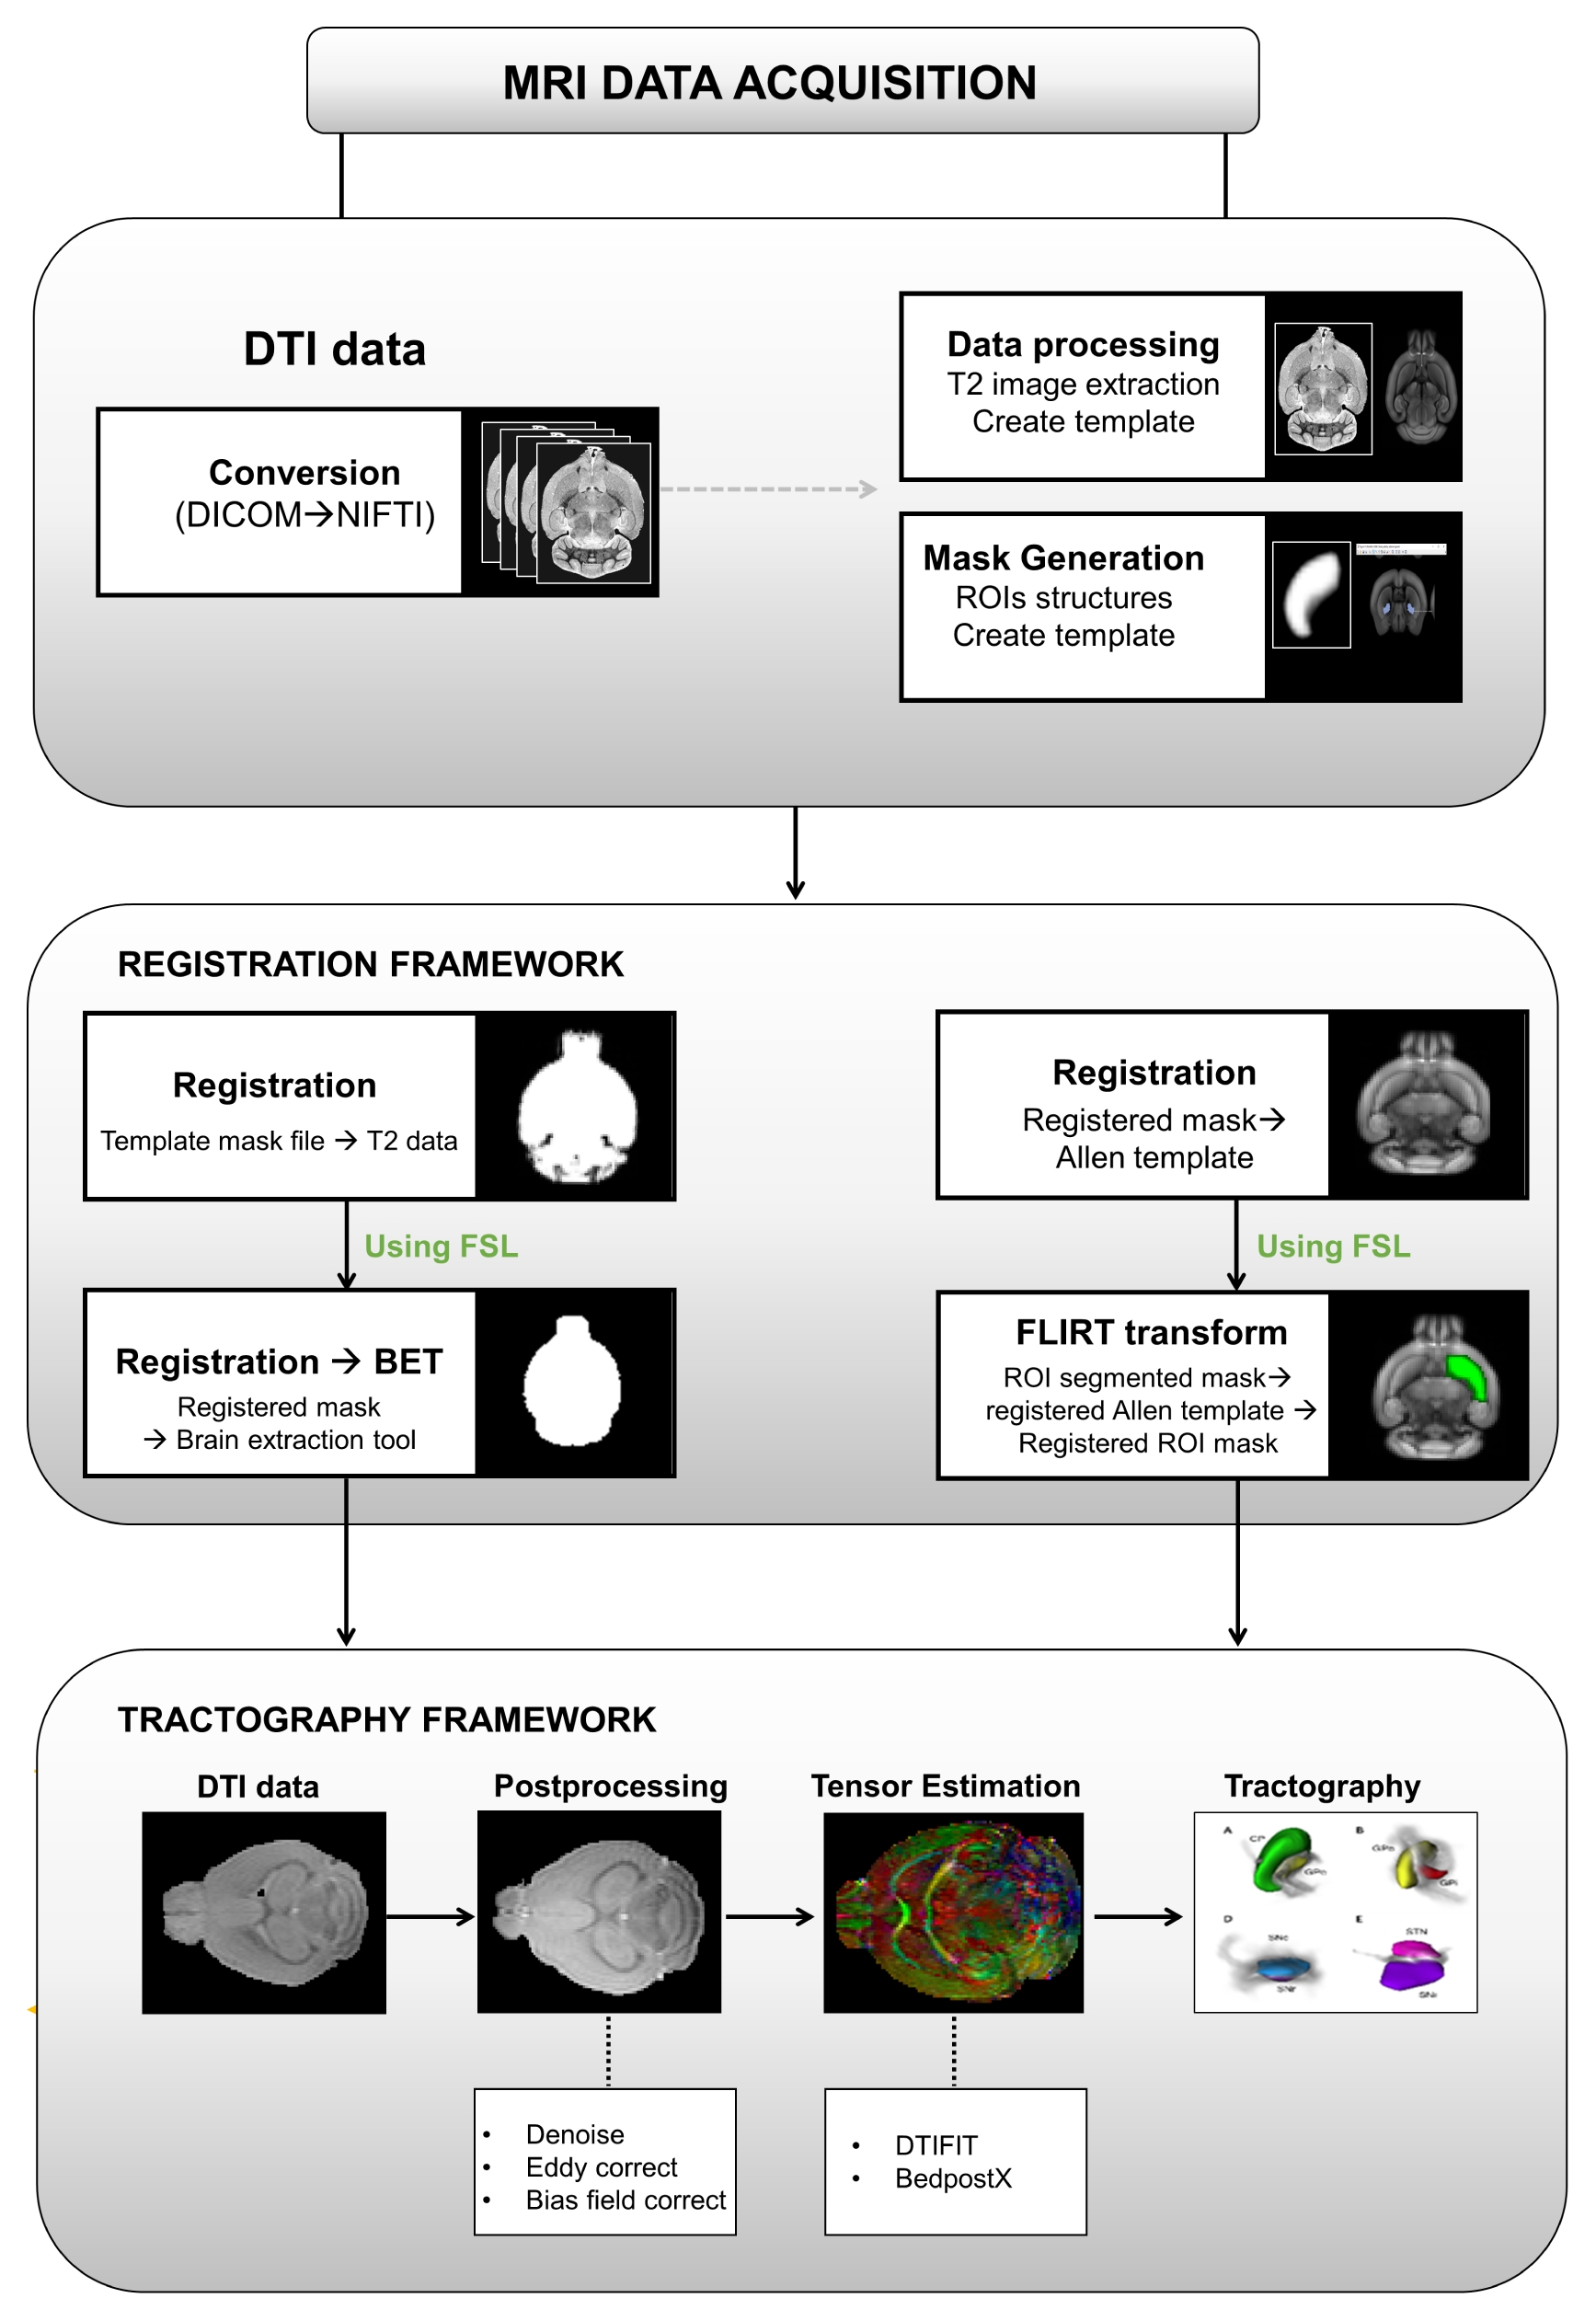
Fig. 1.
Flowchart illustrating the DTI data processing pipeline.
Exp Neurobiol 2020;29:80~92
https://doi.org/10.5607/en.2020.29.1.80
© Exp Neurobiol
© 2019.
The Korean Society for Brain and Neural Sciences
. / Powered by
INFOrang Co., Ltd