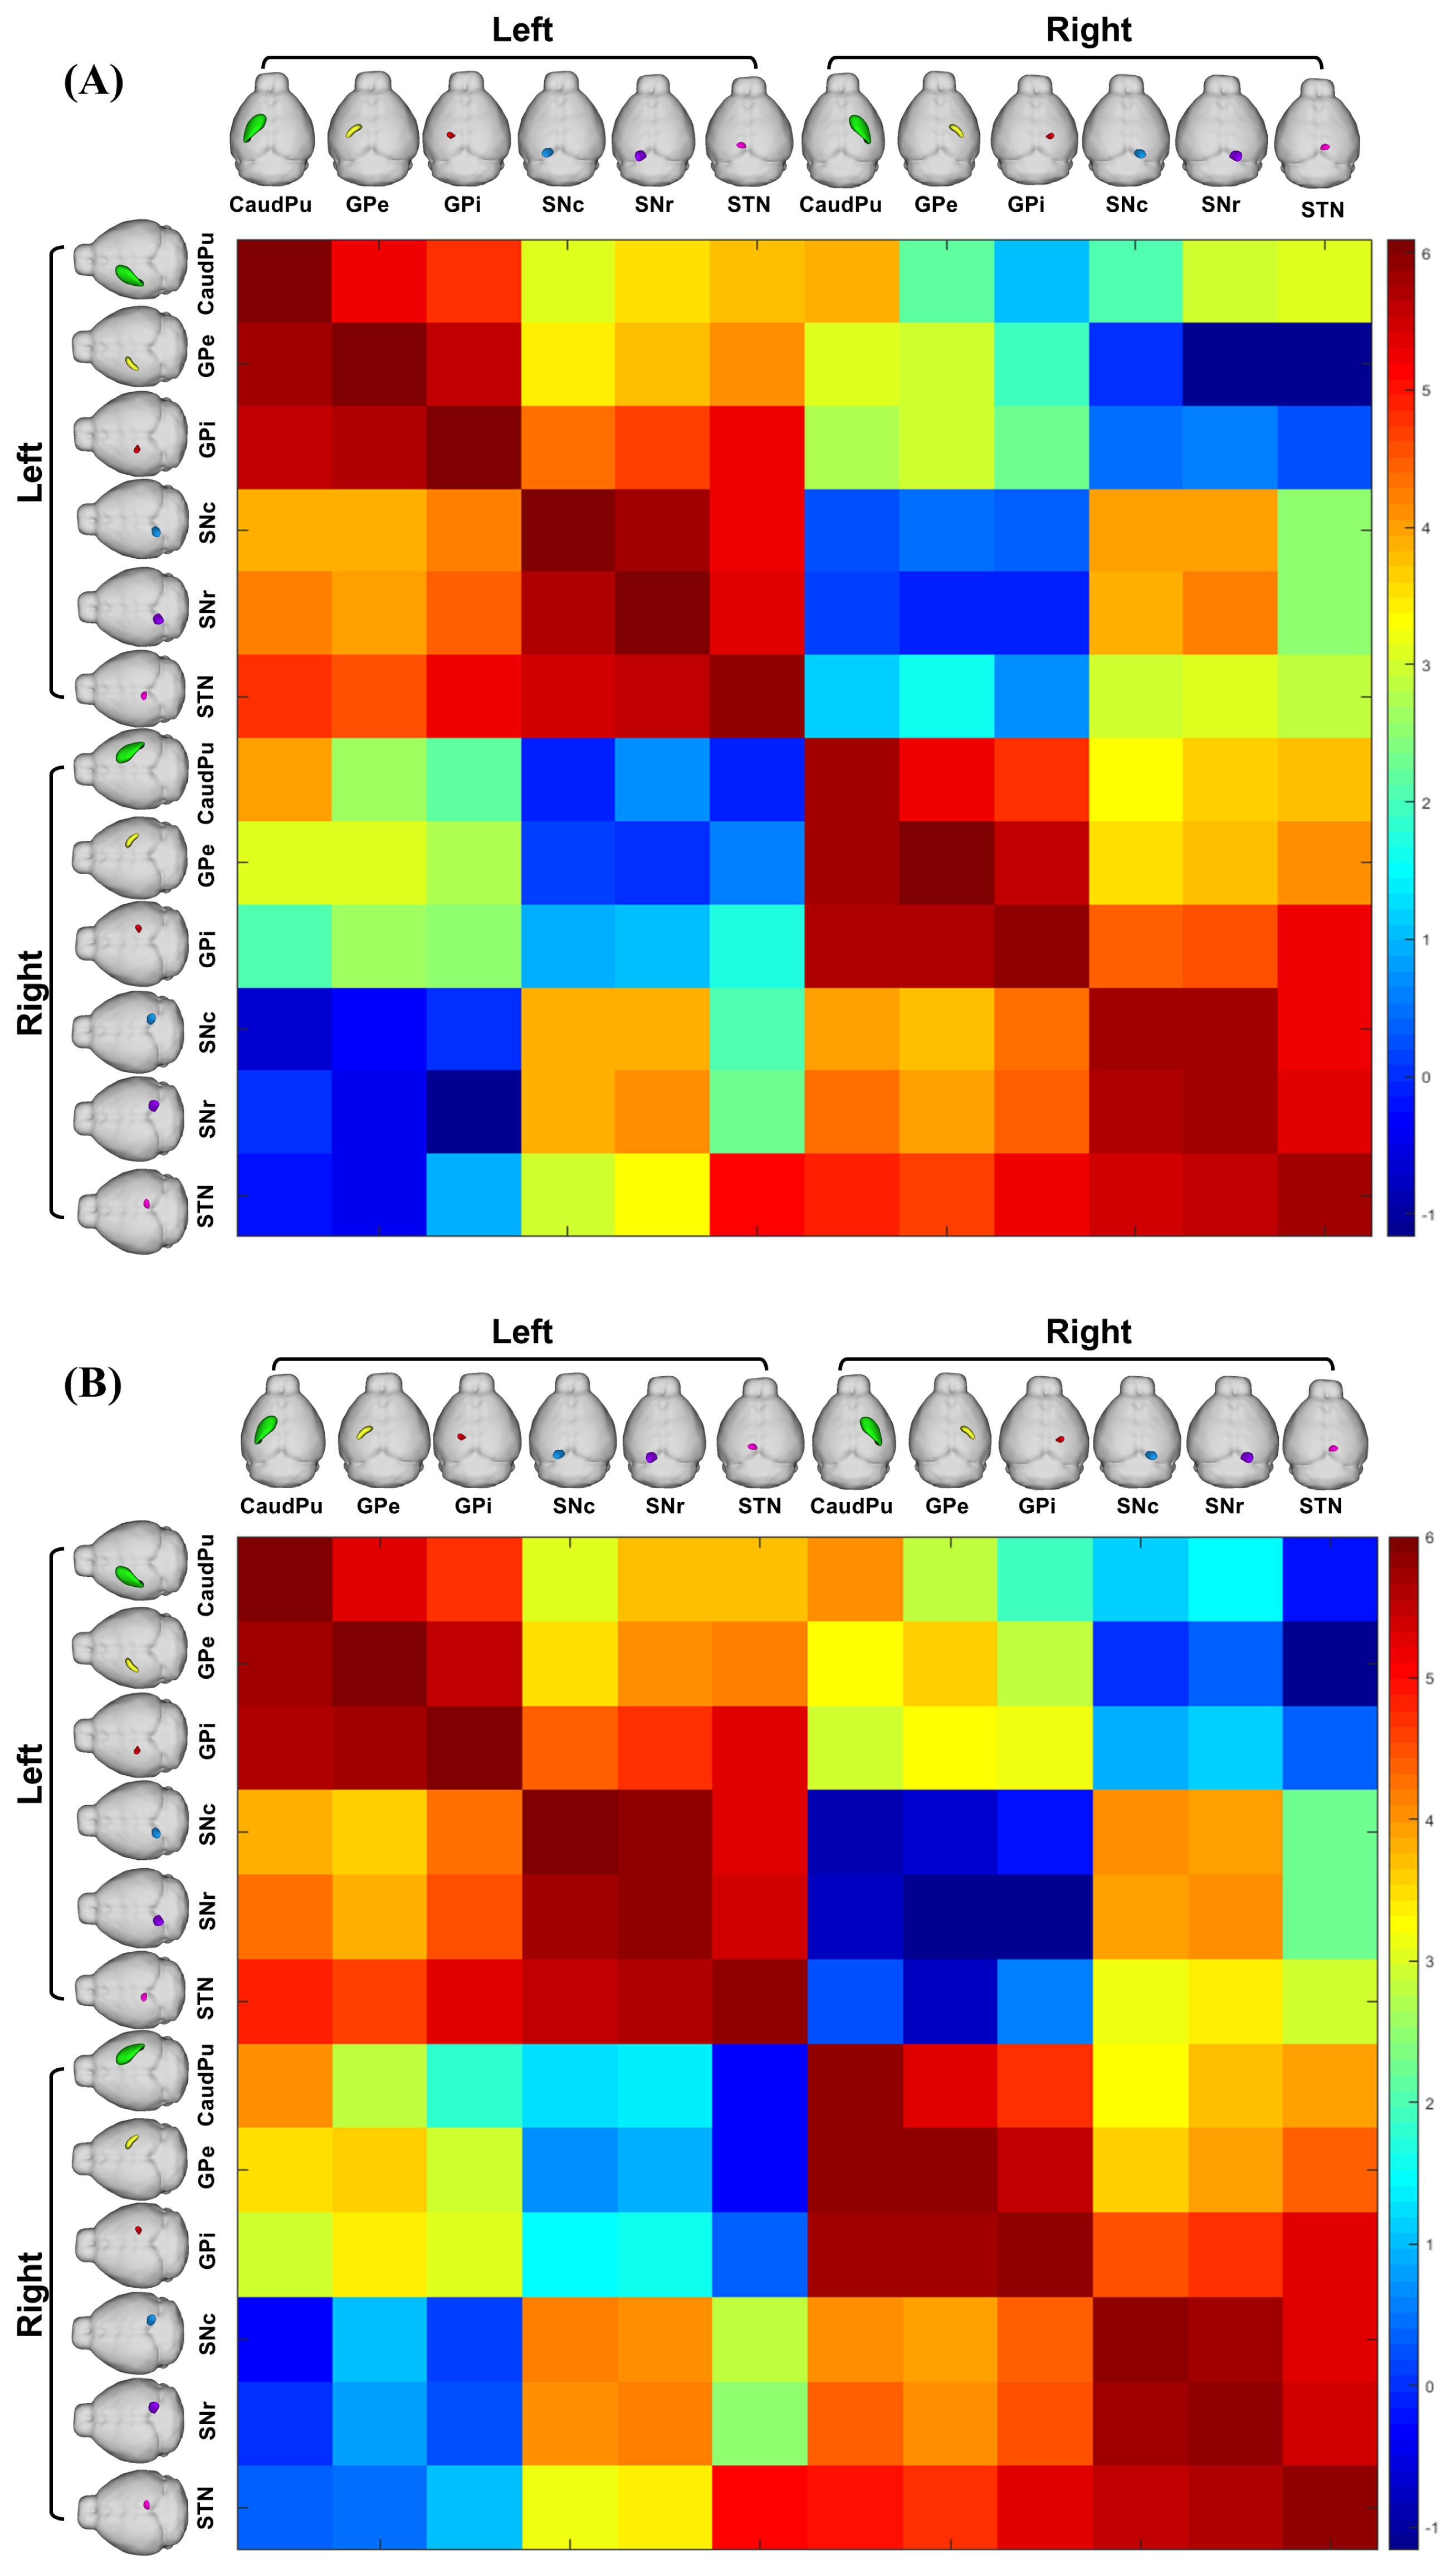
A probabilistic tractography connectivity matrix between seven anatomic regions (CP, STN, GPe, GPi, SNc, SNr, STN) displayed with a log10 scale color map for control groups (A) and 6-OHDA groups (B). The seed regions and the target regions were anatomically located within the 3D rendered mouse, with the seed region on the left and the target region on the top (CP: green, GPe: yellow, GPi: red, SNc: blue, SNr: purple, STN: pink).