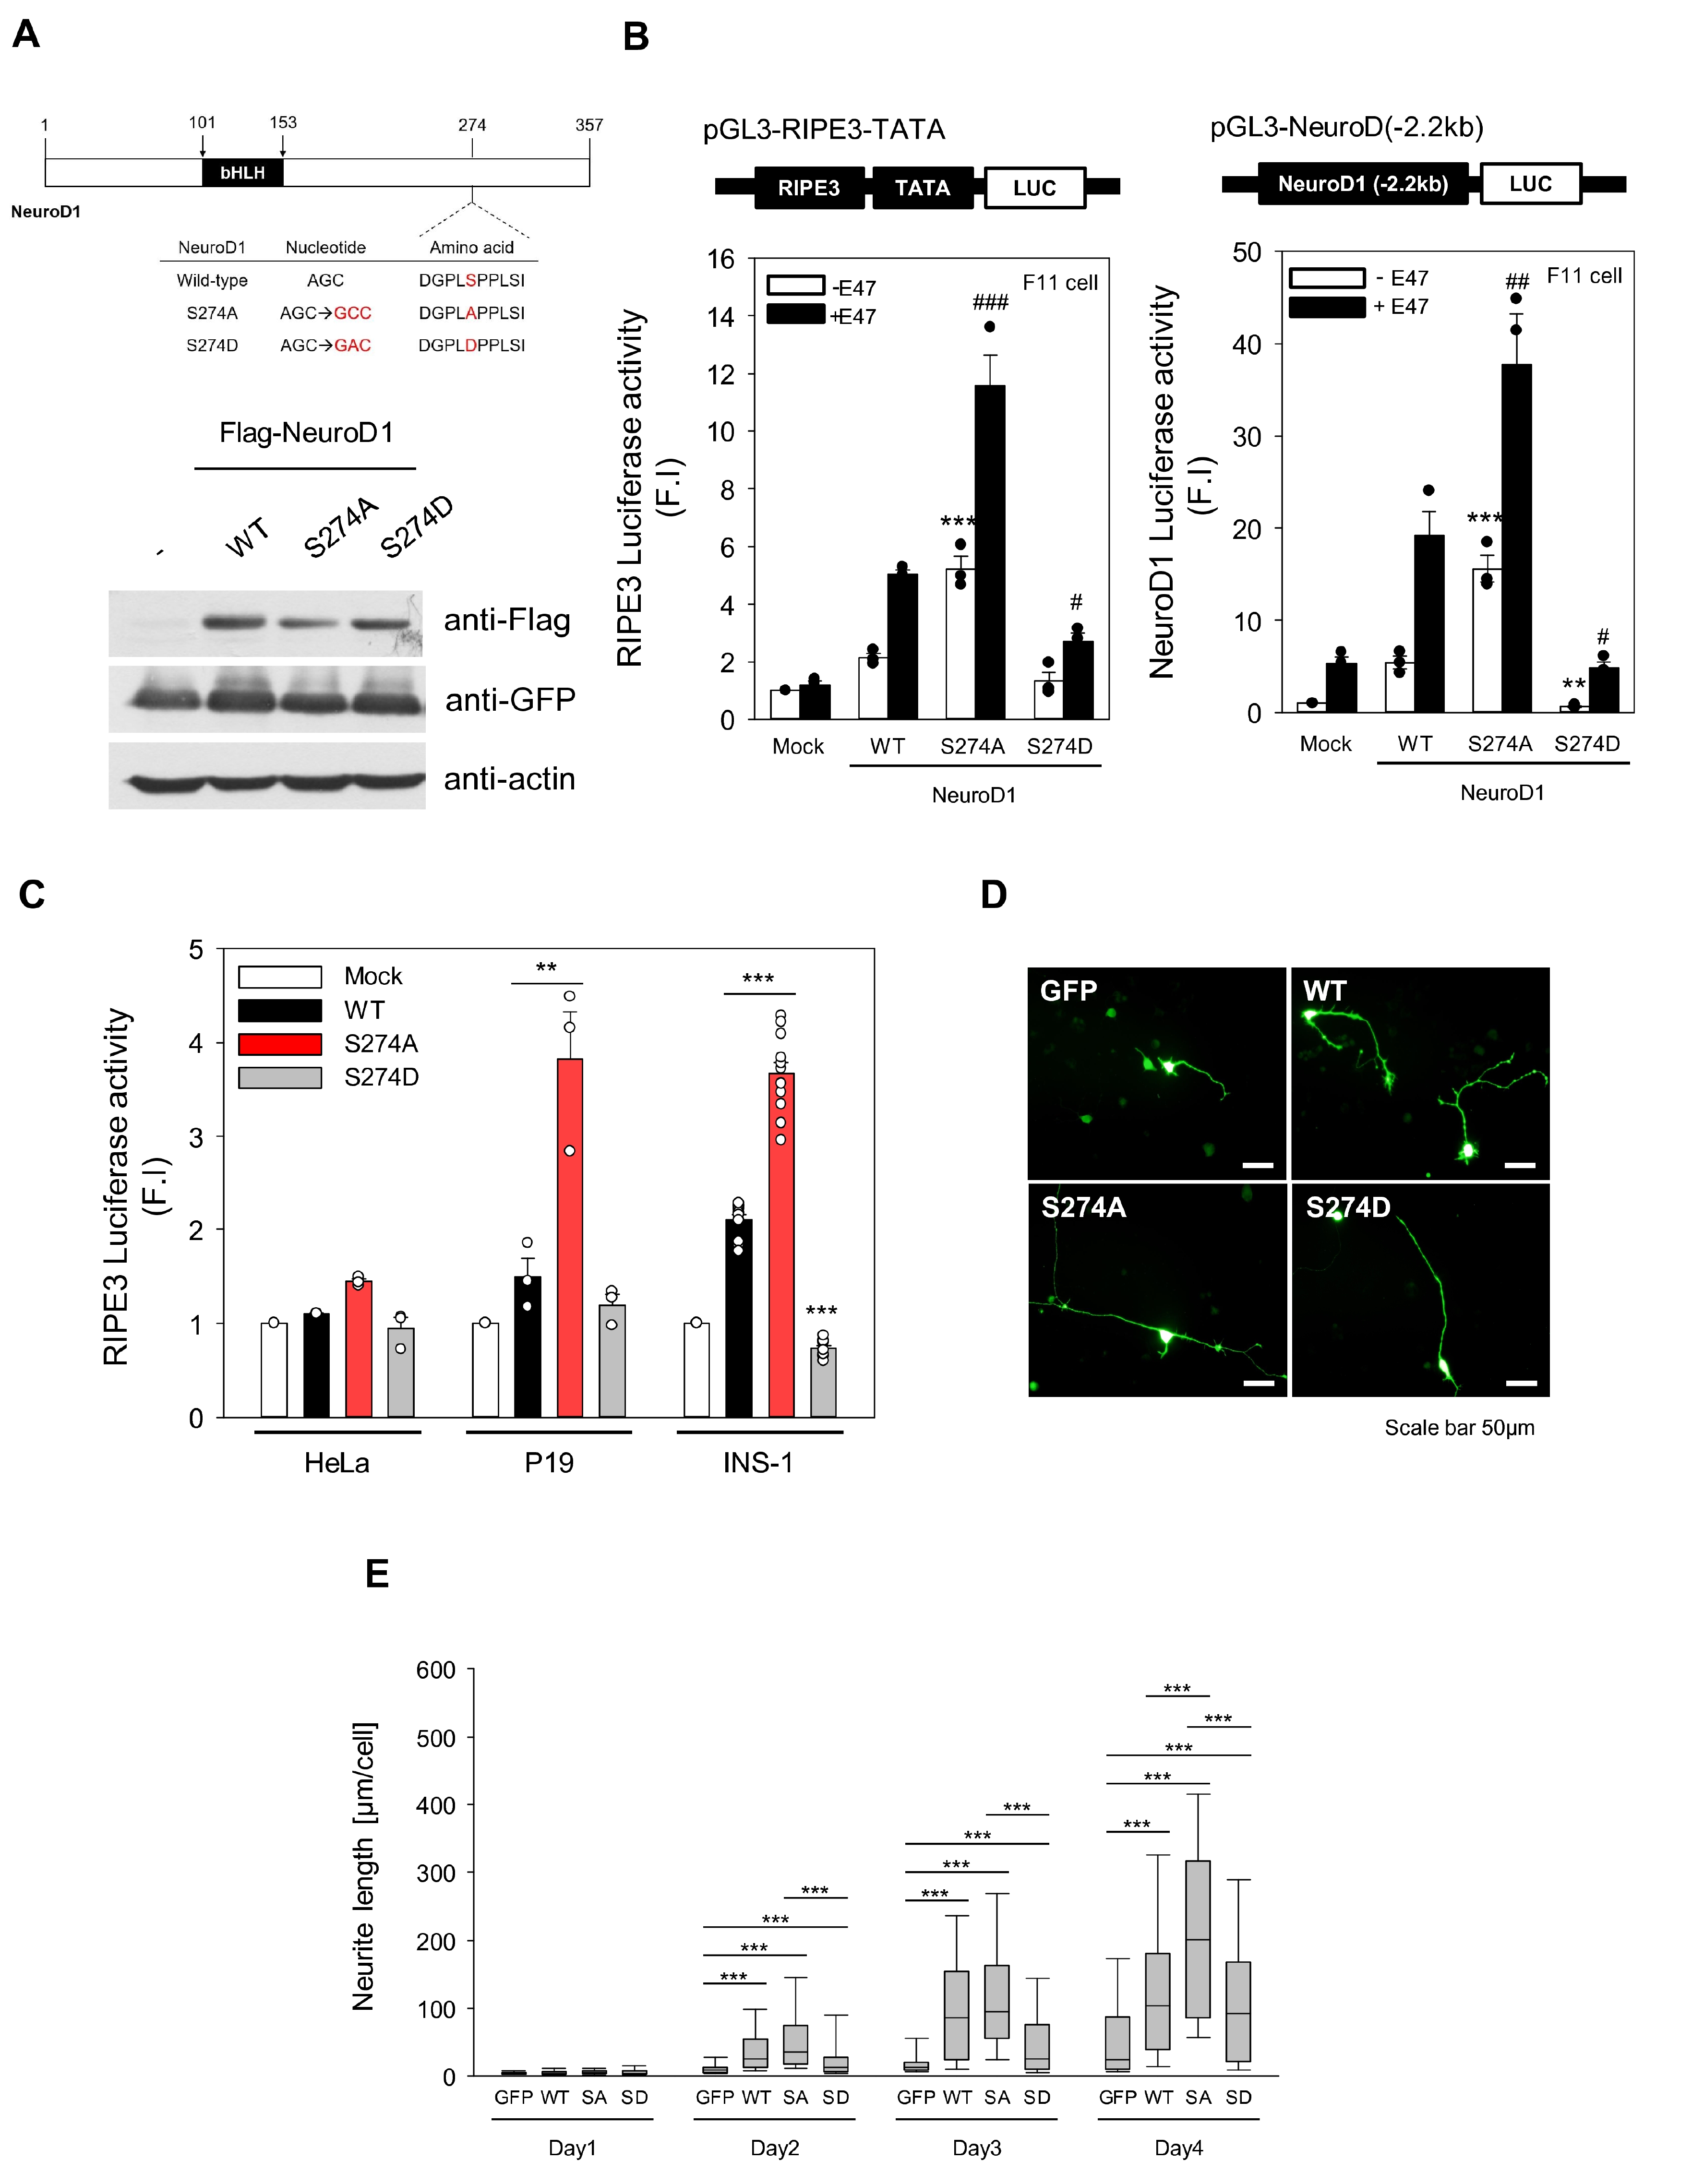
Fig. 5. Transactivation and neurite-promoting activity of neurogenic differentiation 1 (NeuroD1) wild type (WT) and mutants in F11 cells. (A) Schematic diagram of the WT and S274 mutants in the lentivirus transfer vector. Validation of both green fluorescent protein (GFP) and Flag-tagged NeuroD1 proteins by western blot analysis. (B) Schematic representation of the luciferase reporter gene of rat insulin promoter element 3 (RIPE3). Schematic representation of the 2.2 kb promoter region of NeuroD1 containing at least two E-box sequences. F11 cells were transfected with expression vectors for WT and mutants with and without E47. Luciferase activity was presented as the relative ratio to the value of mock transfection. Note that the stimulatory effect of full length S274A was the highest in the presence of E47, whereas the effect of the S274D mutant was minimal. Data are represented as means±S.E. from at least 3 independent experiments (**p<0.01; ***p<0.001, compared to the value of the WT without E47; #p<0.05; ##p<0.01; ###p<0.001, compared to the value of the WT with E47). (C) S274A mutant NeuroD1 significantly increase transcriptional activity, S274D mutant NeuroD1 was the opposite. **p<0.01, ***p<0.001, compare to the value of wild-type NeuroD1, respectively. Data are means±SEM; n=3 in HeLa and P19, n=11 in INS-1, n=number of independent cell culture preparations. (D) F11 cells were transfected with lentiviral transfer vectors encoding GFP with WT or S274 mutants. Following transfection, fluorescence images were obtained at the indicated time post-transfection. (E) Neurite length was quantified by the NeuronJ plugin of the ImageJ software program. Data are represented as means±S.E. from at least 50 transfected cells per group (***p<0.001, between groups).
© Exp Neurobiol