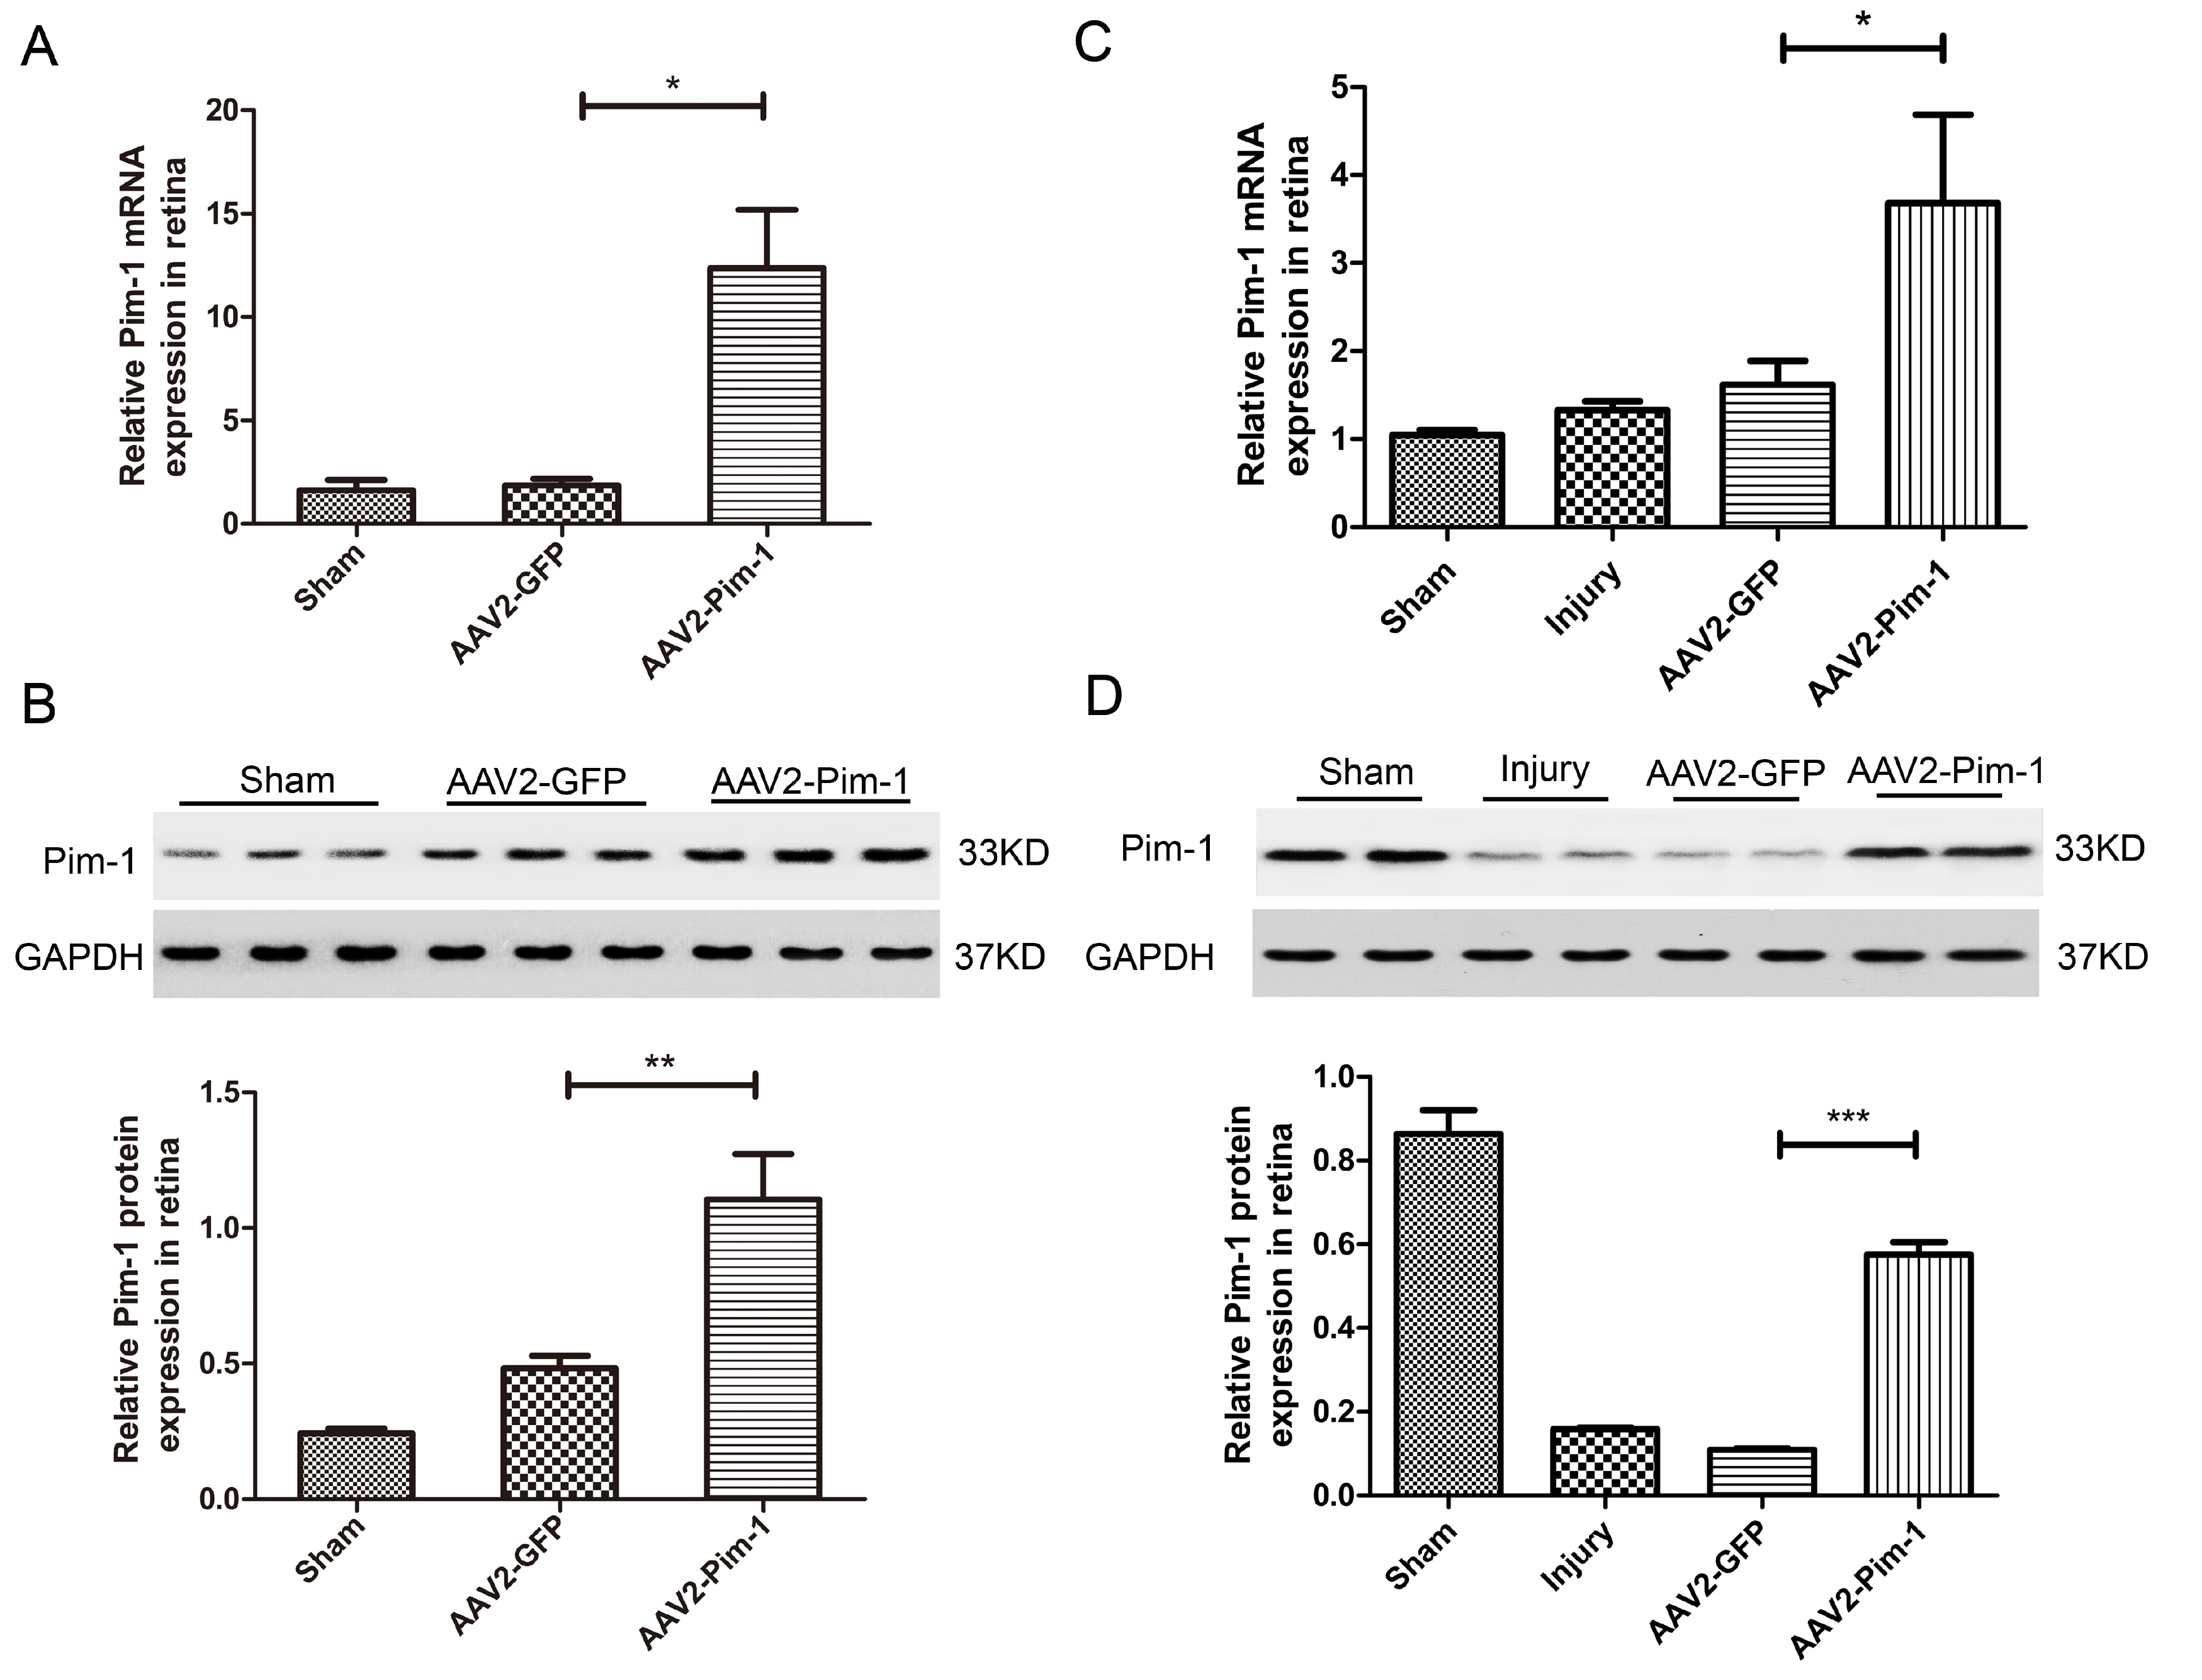
Fig. 2. Pim-1 mRNA and protein overexpressions in the retina after AAV2-Pim-1 infection in the normal rat retina (A, B) and in the retina 2 weeks after ONC (C, D) in vivo. (A, C) Detection of Pim-1 mRNA expression in the retina by Real-time PCR in each group. (B, D) Detection of Pim-1 protein expression in the retina by Western blotting in each group. The relative protein levels in Y-axis was quantified by dividing the gray value of the experimental groups by the gray value of GAPDH. Compared with the AAV2-GFP group, *p<0.05, **p<0.01, ***p<0.001; n=6.
© Exp Neurobiol