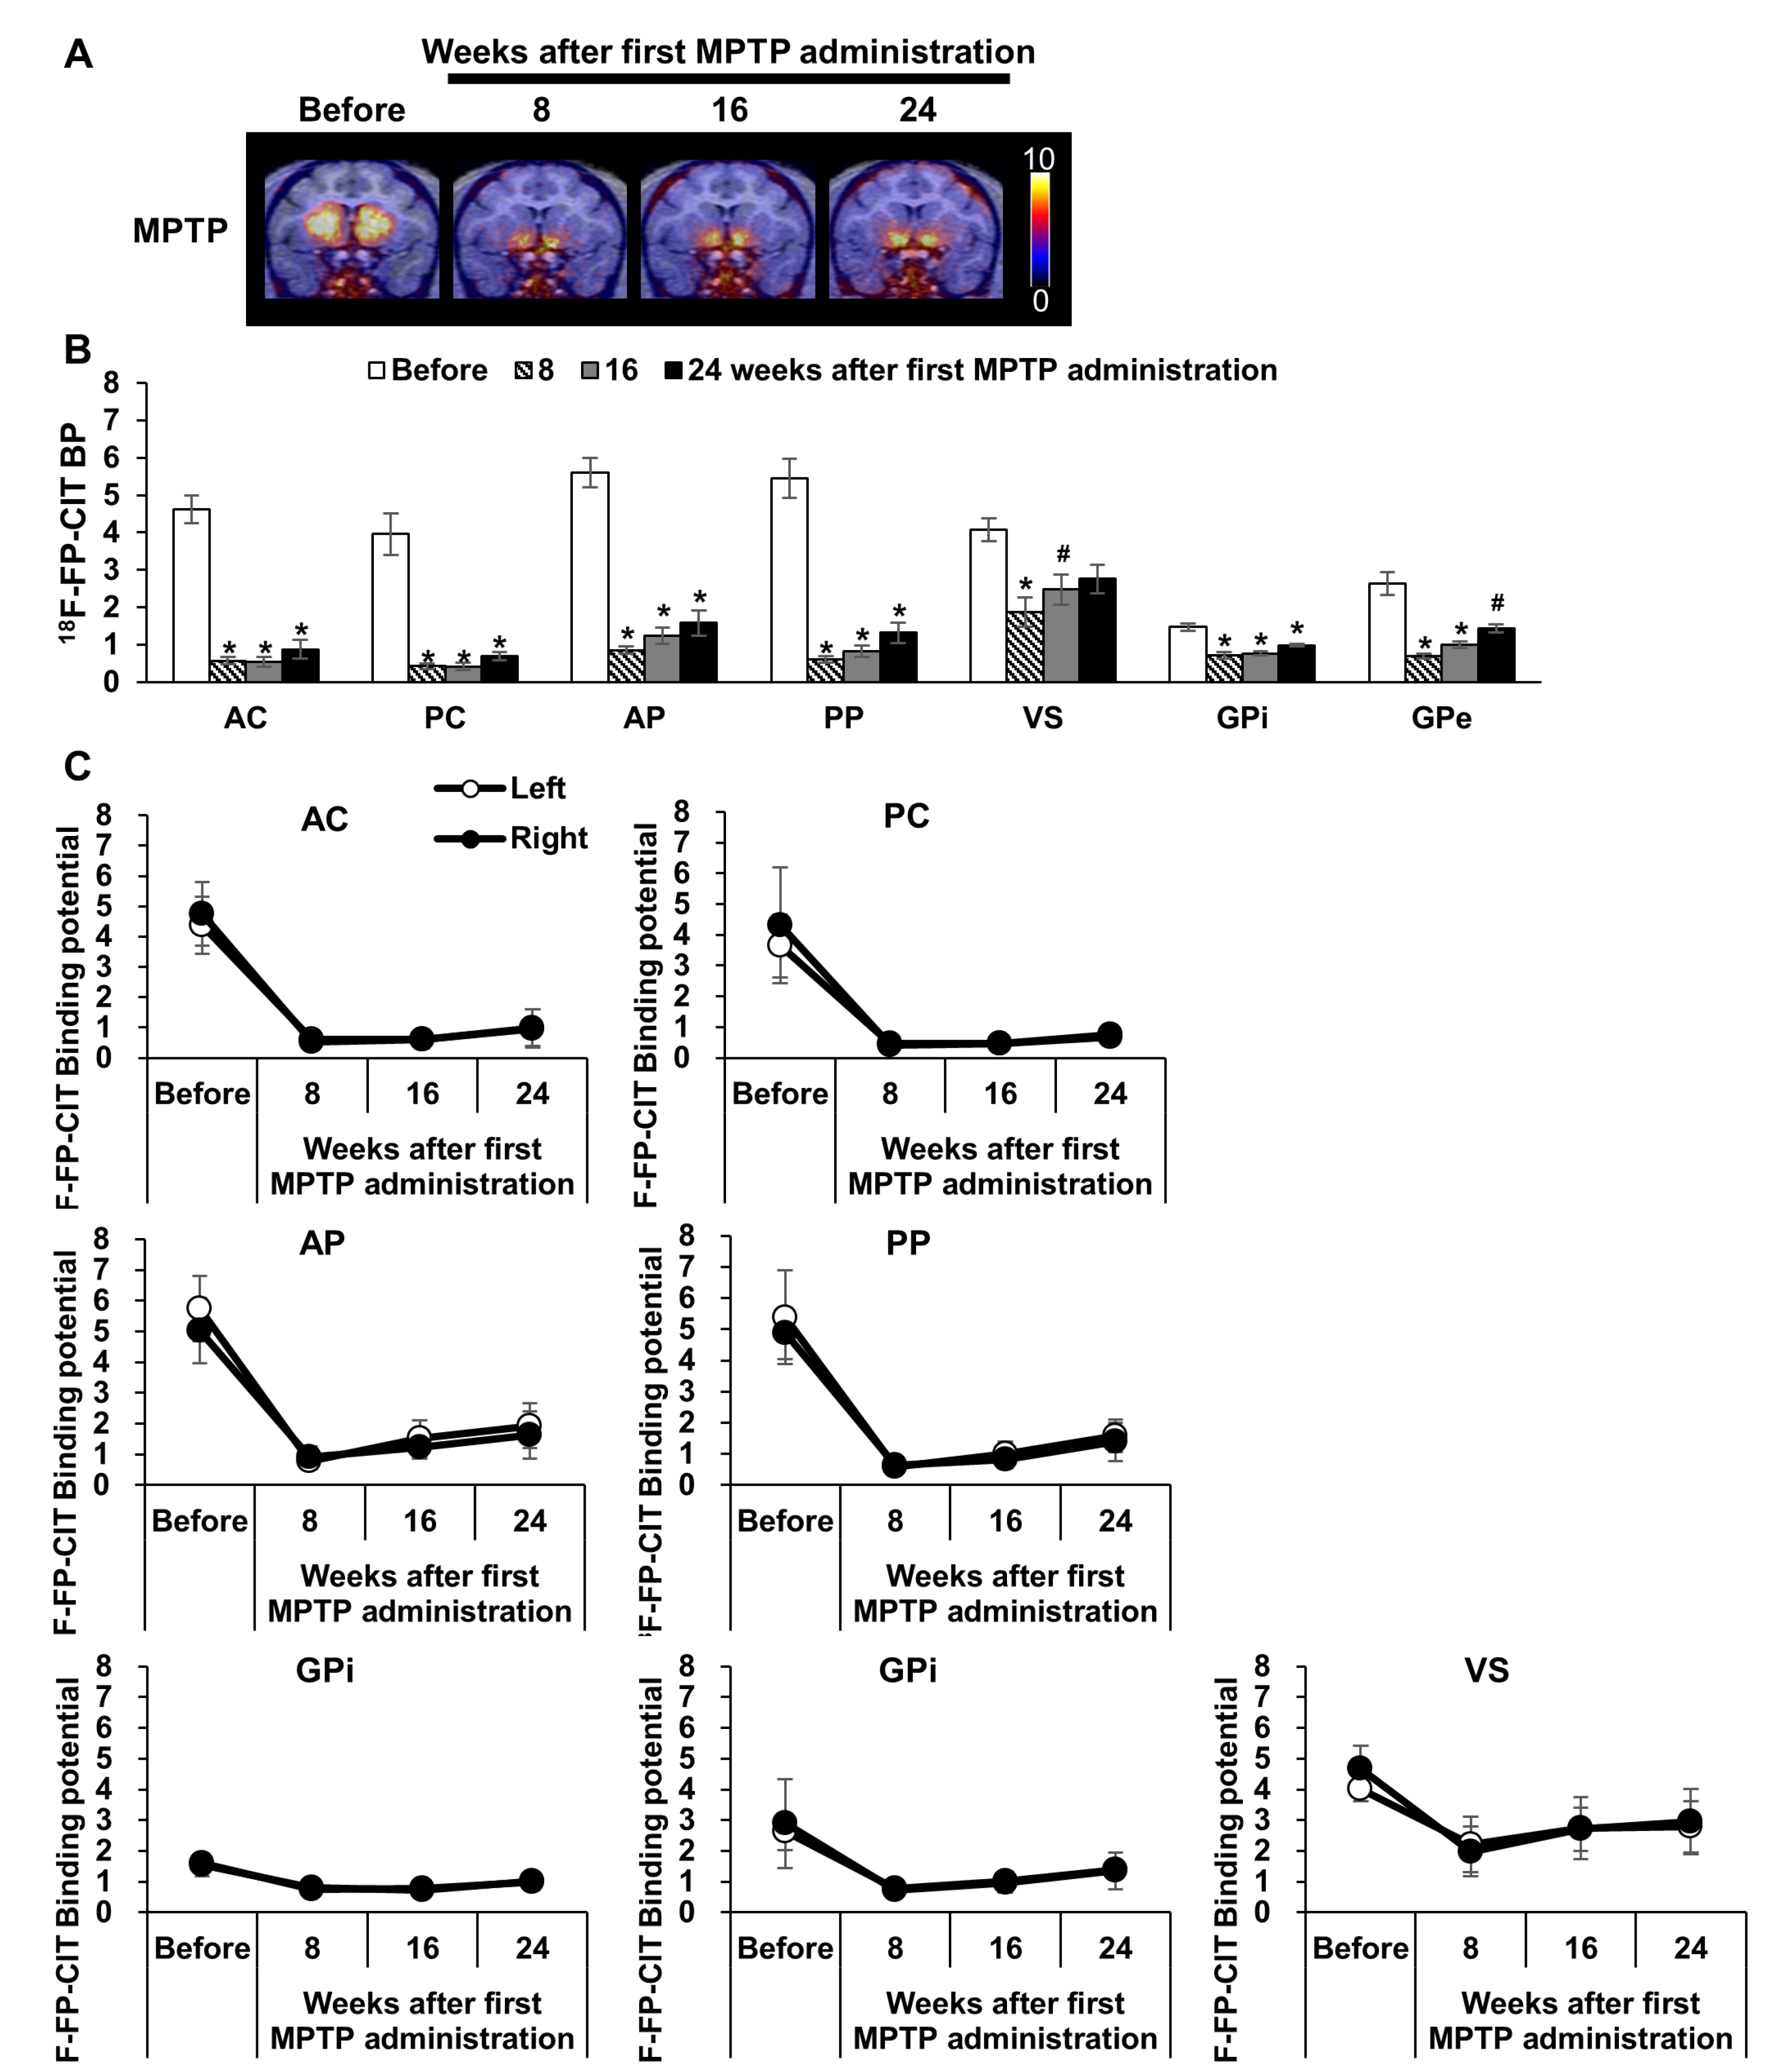
Fig. 6. Correlation between hand dexterity task (HDT) and dopamine transporter (DAT) activity. (A) Representative 18F-FP-CIT positron emission tomography (PET) images to indicate DAT at 8, 16 and 24 weeks timepoints after MPTP injections. (B) Histogram representing 18F-FP-CIT binding potential (BP) in the MPTP-injection group. (C) Quantitative analysis using the 18F-FP-CIT binding potential of positron emission tomography imaging showing presynaptic dopamine transporter level of left and right hemispheres separately in MPTP injected monkeys. AC, anterior caudate; PC, posterior caudate; AP, anterior putamen; PP, posterior putamen; VS, ventral striatum; GPi, globus pallidus interna; GPe, globus pallidus external. The clear bar indicates the level before MPTP injections in the MPTP injected group.
© Exp Neurobiol