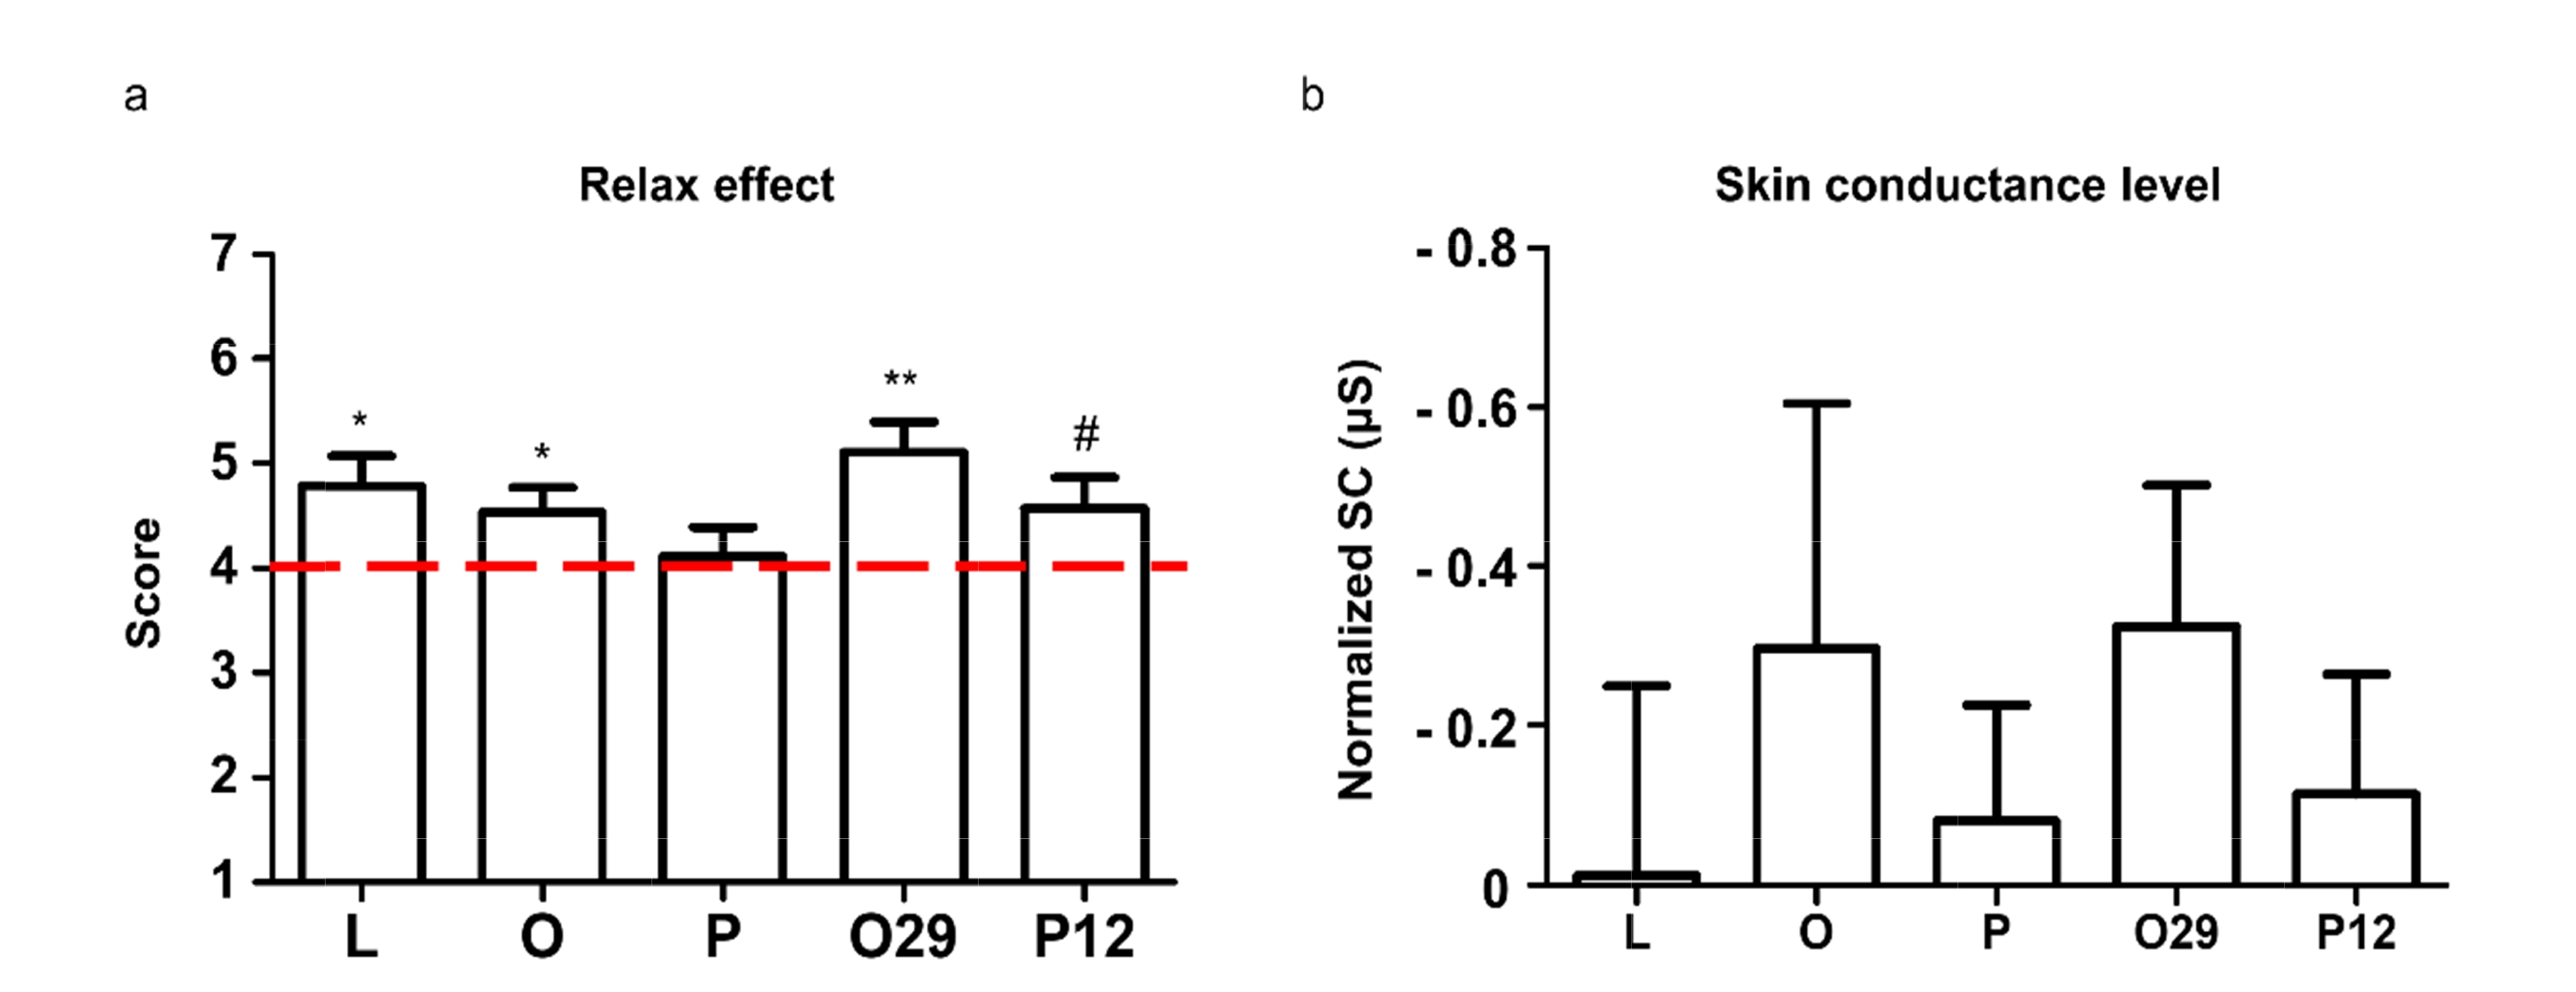
Fig. 3. Survey and physiological responses to fragrance after NAPS. (a) Survey results of the fragrance effect after NAPS. One sample t-test was performed to verify the difference from the middle (score 4, one-tail). (b) Skin conductance level of the fragrance effect after NAPS. Each SCL was calculated by (average SCL data during fragrance periods)– (average SCL data during baseline periods). Normalized skin conductance was calculated by each fragrance condition SCL– no odor condition SCL. Y-axis is inversed in this graph. Two sample t-test performed to verify the difference from no-odor condition (no-odor condition set to 0, one-tail) (#p<0.1, *p<0.05, **p<0.01).
© Exp Neurobiol