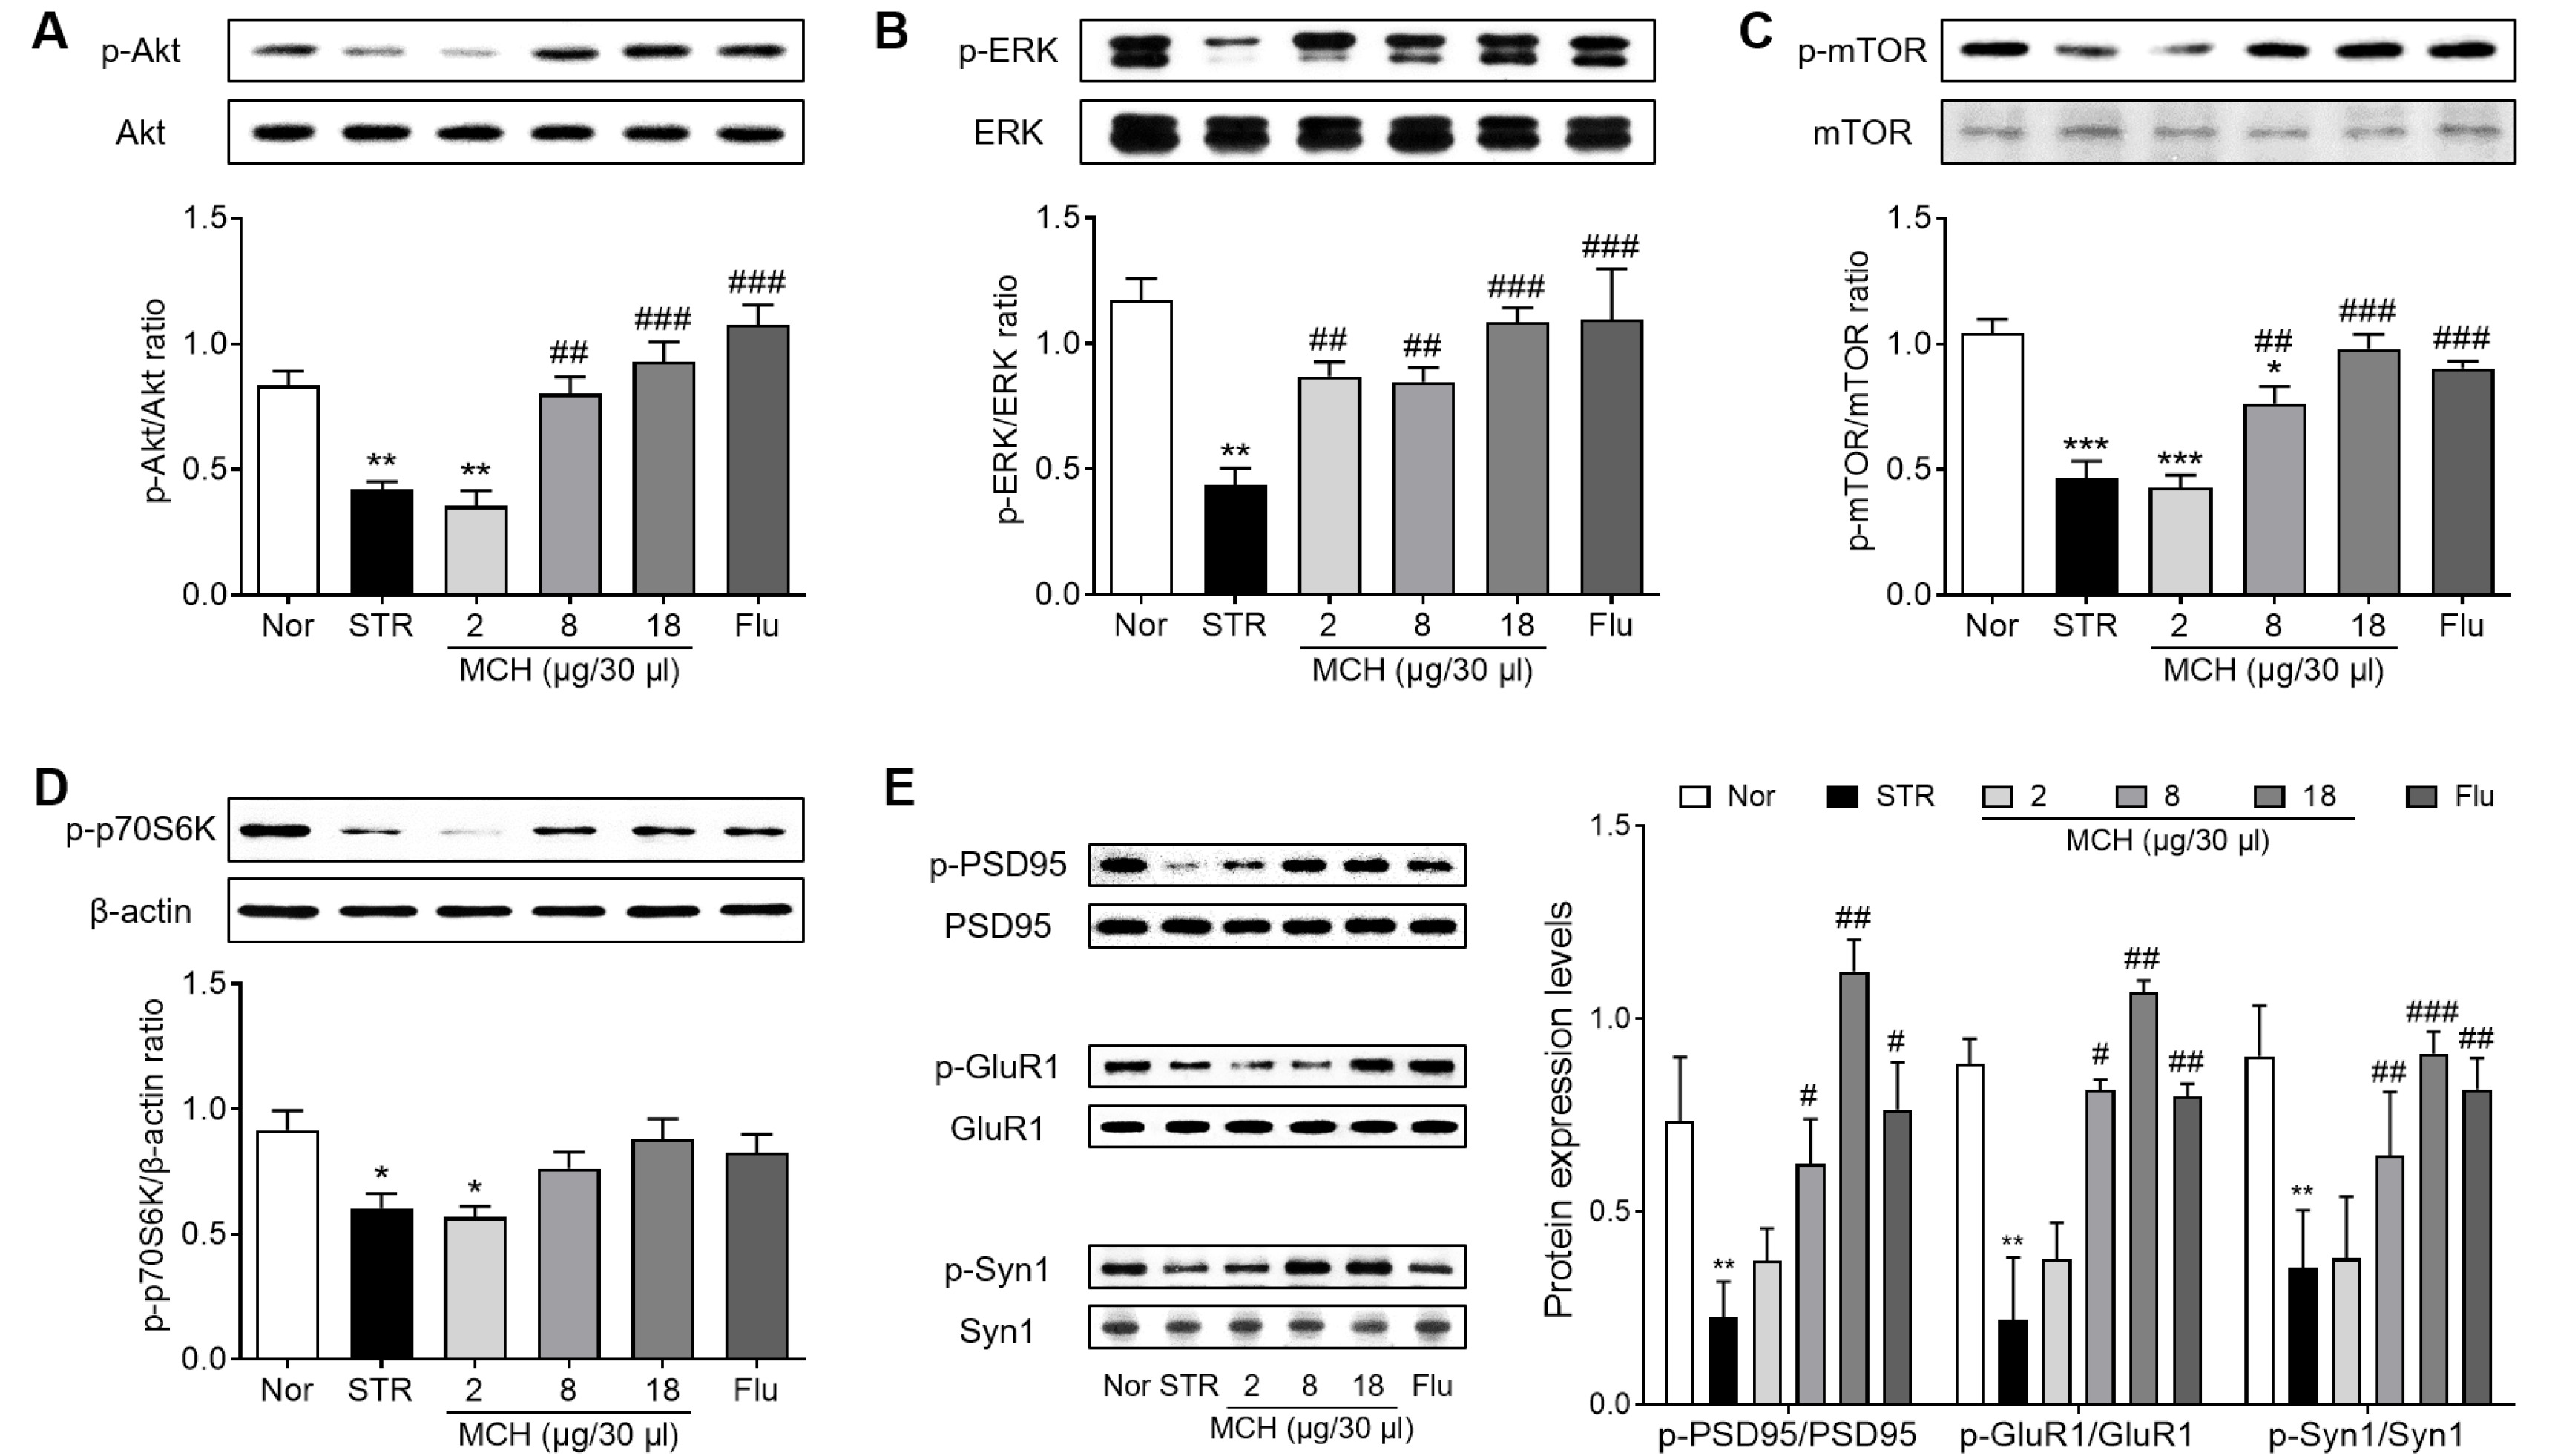
Fig. 2. Activation of the mTOR signaling pathway and synaptic proteins after MCH administration. Western blot analysis of protein expression levels of (A) Akt, (B) ERK, (C) mTOR, (D) p70S6K, and (E) synaptic proteins in stressed rats. The amount of phosphorylated proteins was normalized to that of total proteins and presented in bar graphs except p70S6K. The amount of phosphorylated p70S6K was normalized to that of β-actin. Data represent the means±SEM. ***p<0.001, **p<0.01, *p<0.05 vs. Nor group, ###p<0.001, ##p<0.01, #p<0.05 vs. STR group. Nor, normal; STR, stress; Flu, fluoxetine.
© Exp Neurobiol