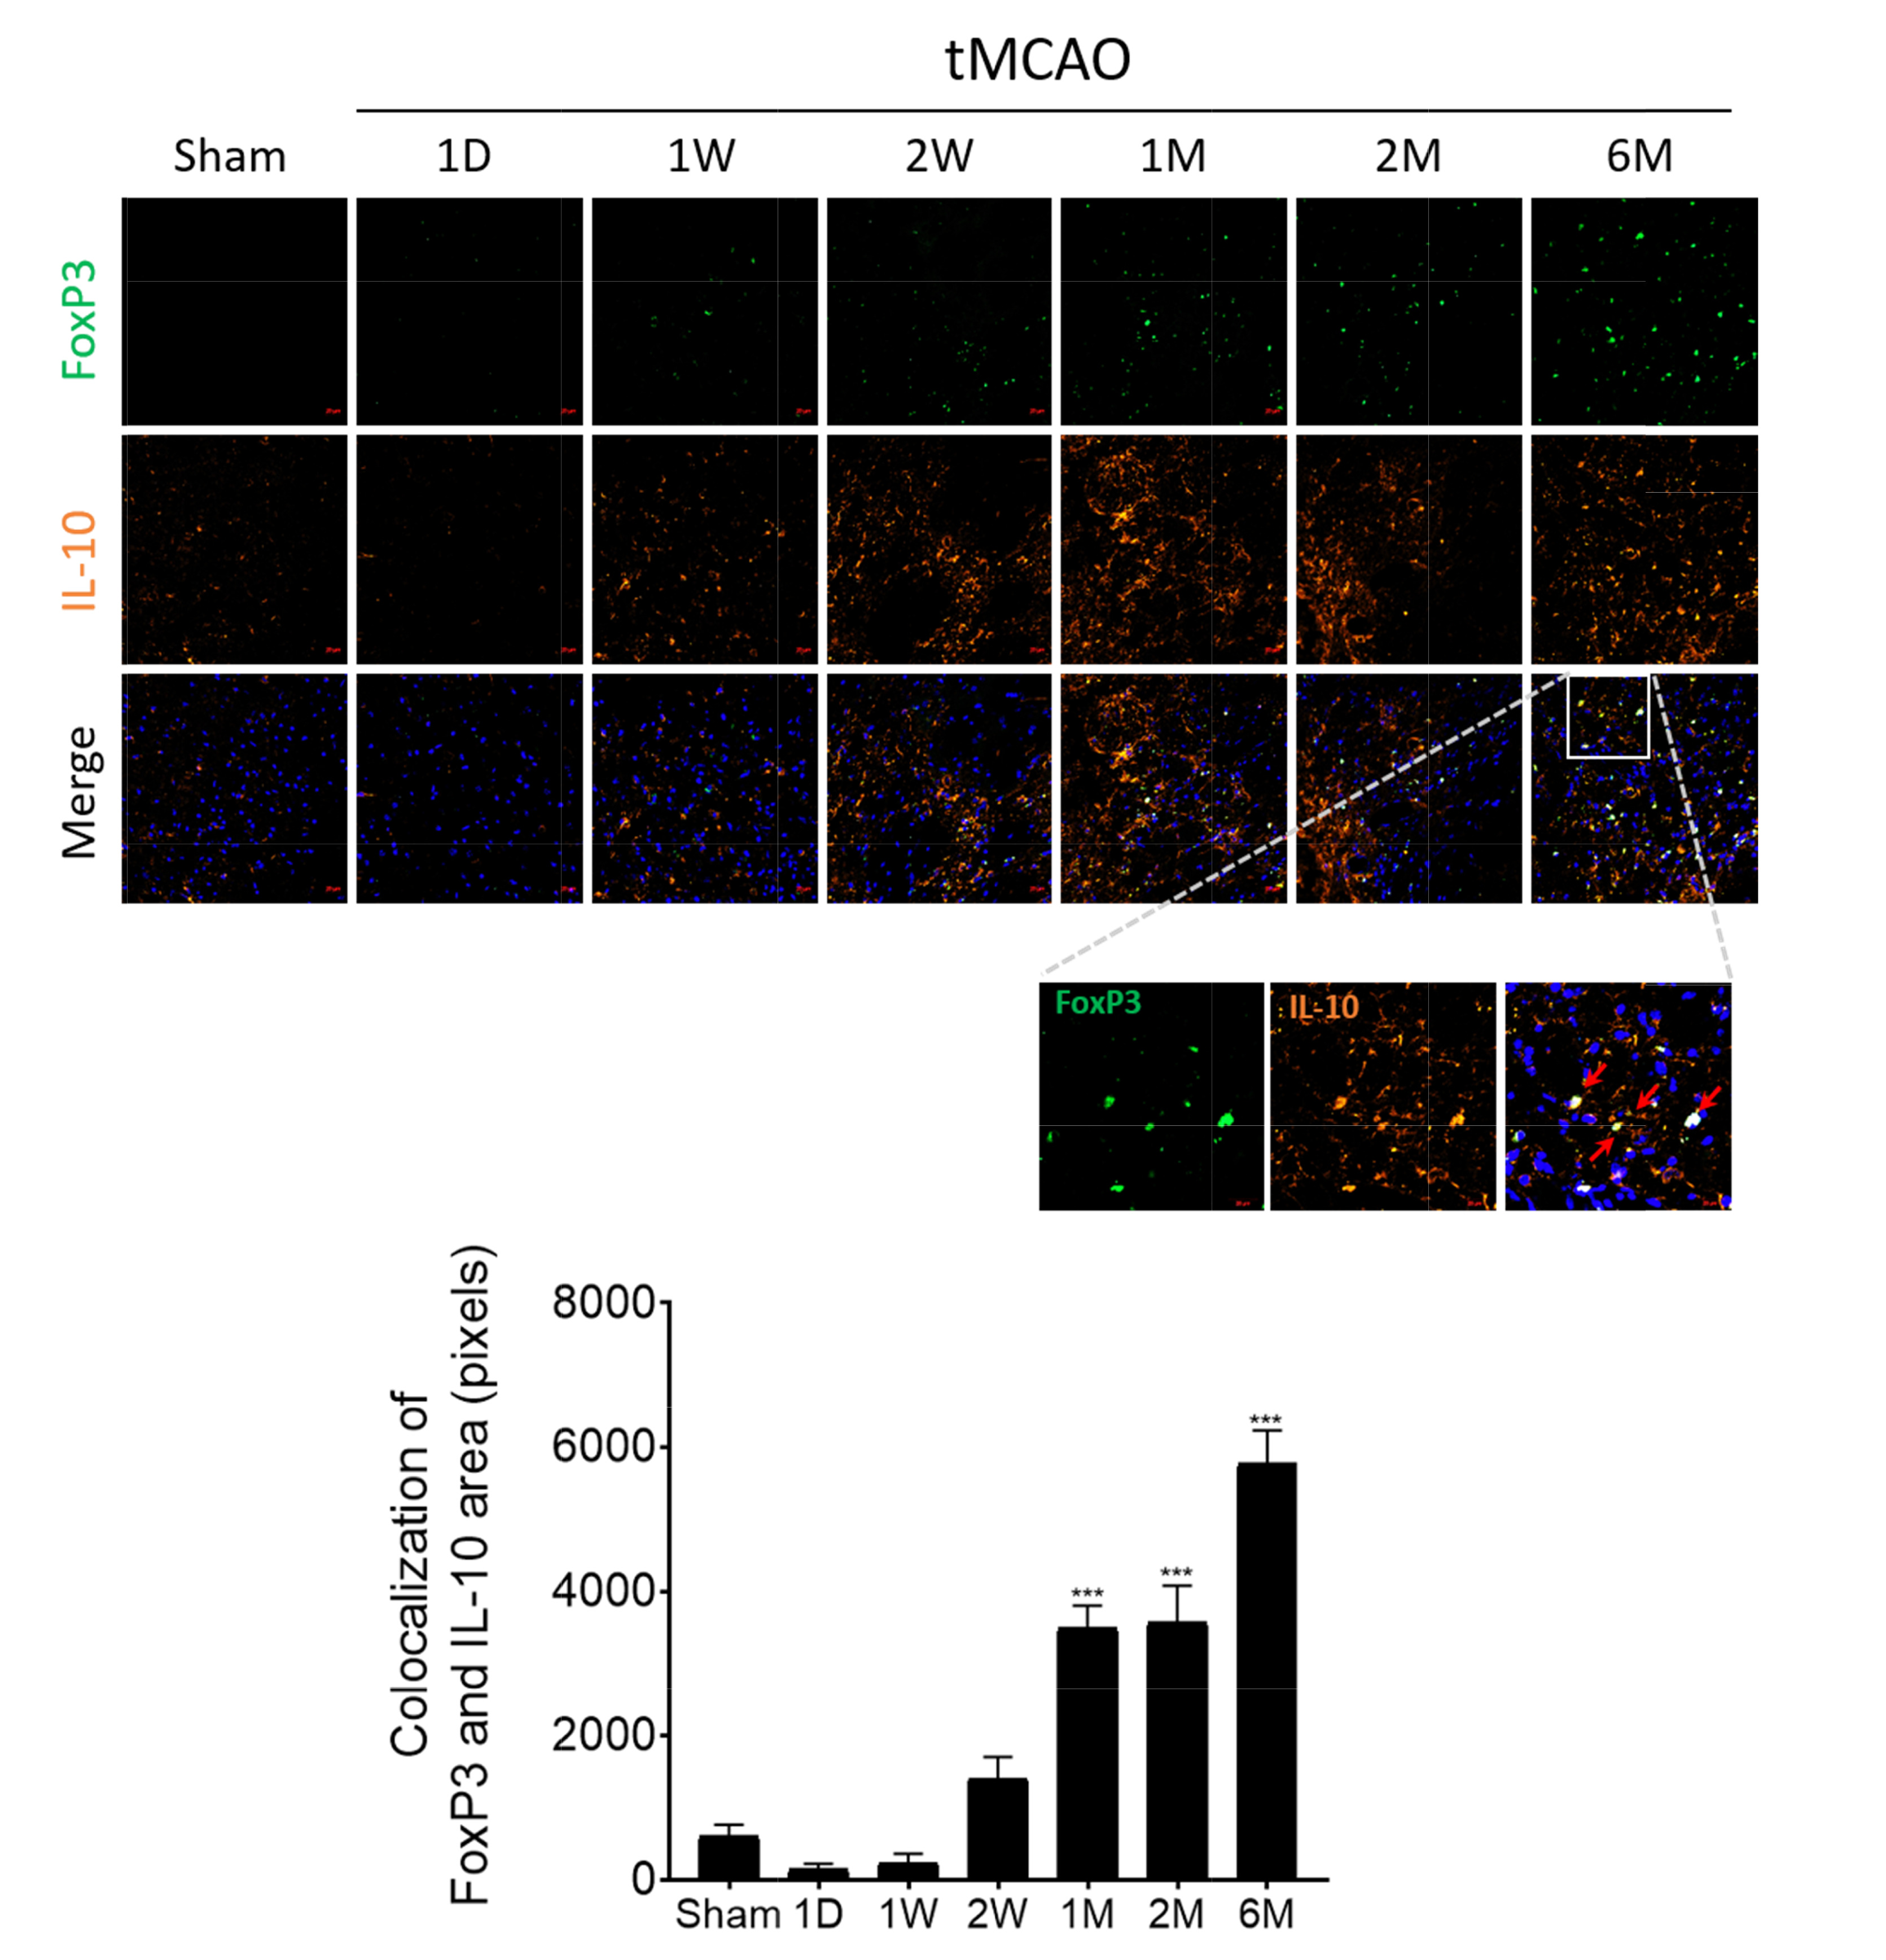
Fig. 7. Analysis of IL-10+Foxp3+ Tregs in the brain. Brain tissues were processed for immunohistochemical analysis at one day to six months post-tMCAO. Fluorescence images of Foxp3 (green), IL-10 (orange), and DAPI (blue). A white square was expanded in a large image of the ischemic region. Red arrows indicate Treg cells. Scale bar=20 µm. Mice numbers were sham (n=8), tMCAO 1 d (n=3), 1 week (n=3), 2 weeks (n=3), 1 m (n=5), 2 m (n=8), and 6 m (n=6). ***p≤0.001.
© Exp Neurobiol