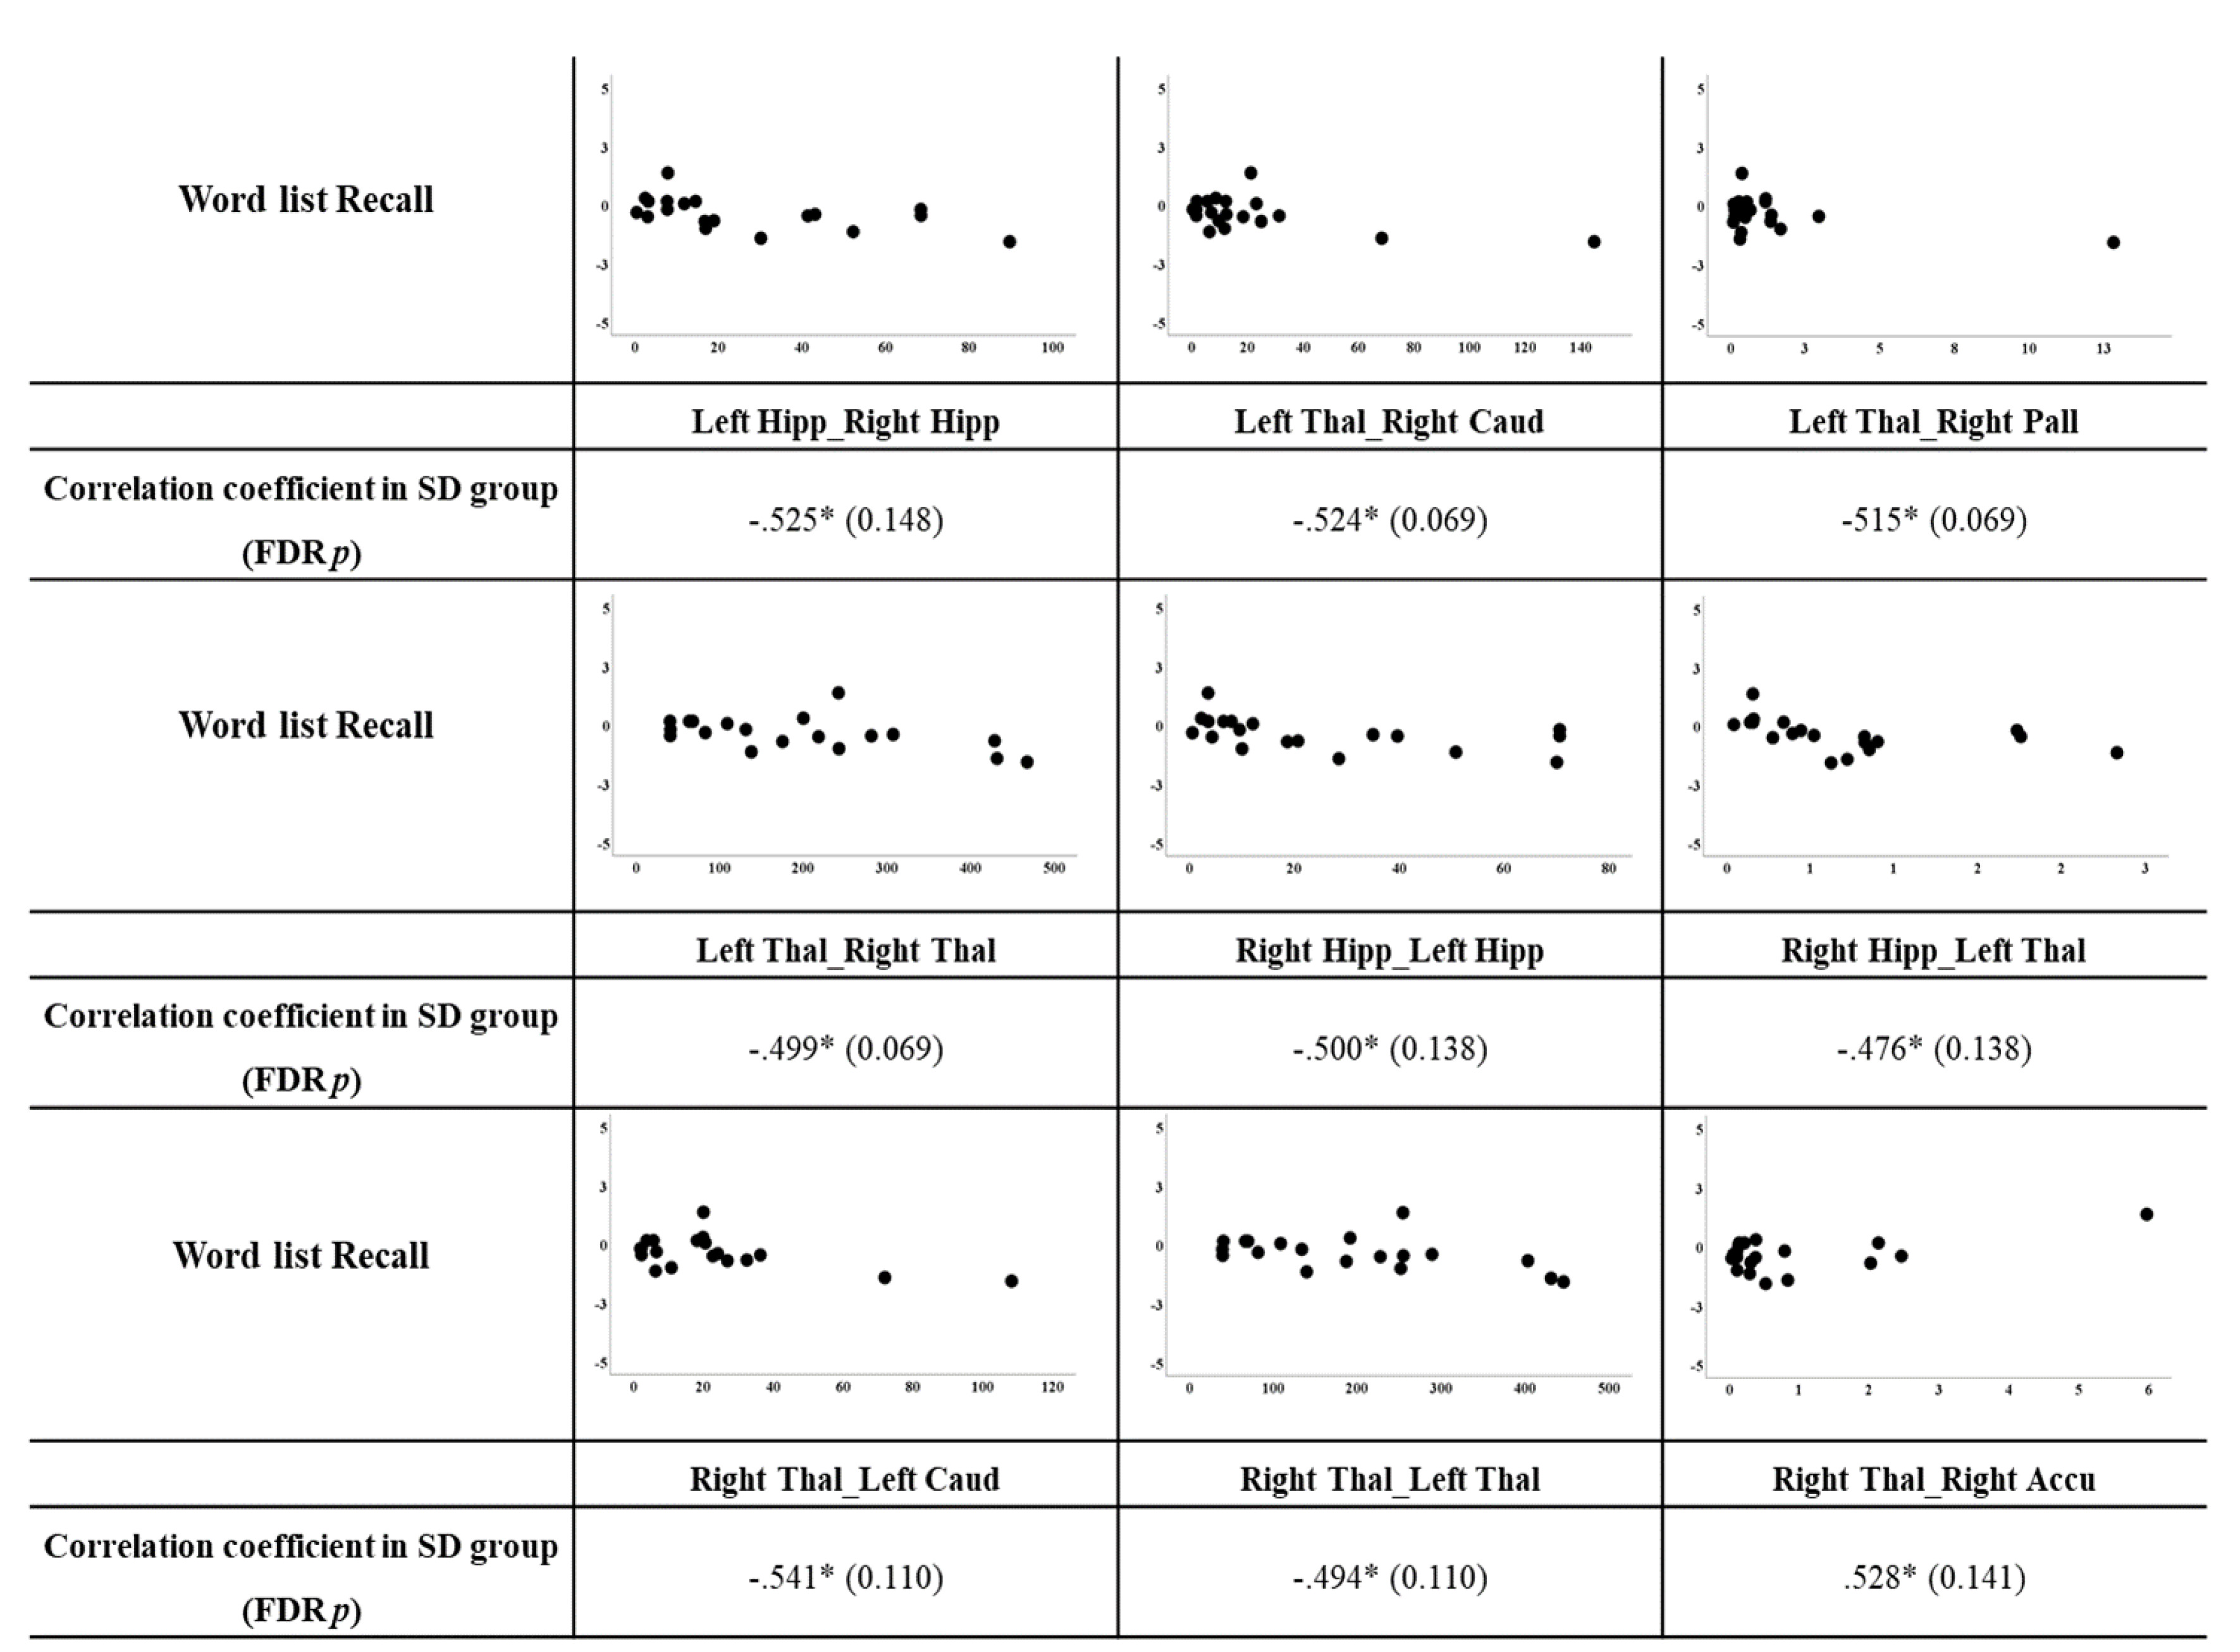
Fig. 8. A scatterplot graph of the correlation between the connection pathways and neuropsychological test scores showing significant differences. The horizontal axis of the graph is the strength of the connection between structures showing significant differences, and the vertical axis is the neuropsychological test score of z-score. Only the significant p-values that passed the FDR correction (p≤0.2) are displayed. Accu, Nucleus Accumbens; Caud, Caudate; Hipp, Hippocampus; Pall, Pallidus; Thal, Thalamus.
© Exp Neurobiol