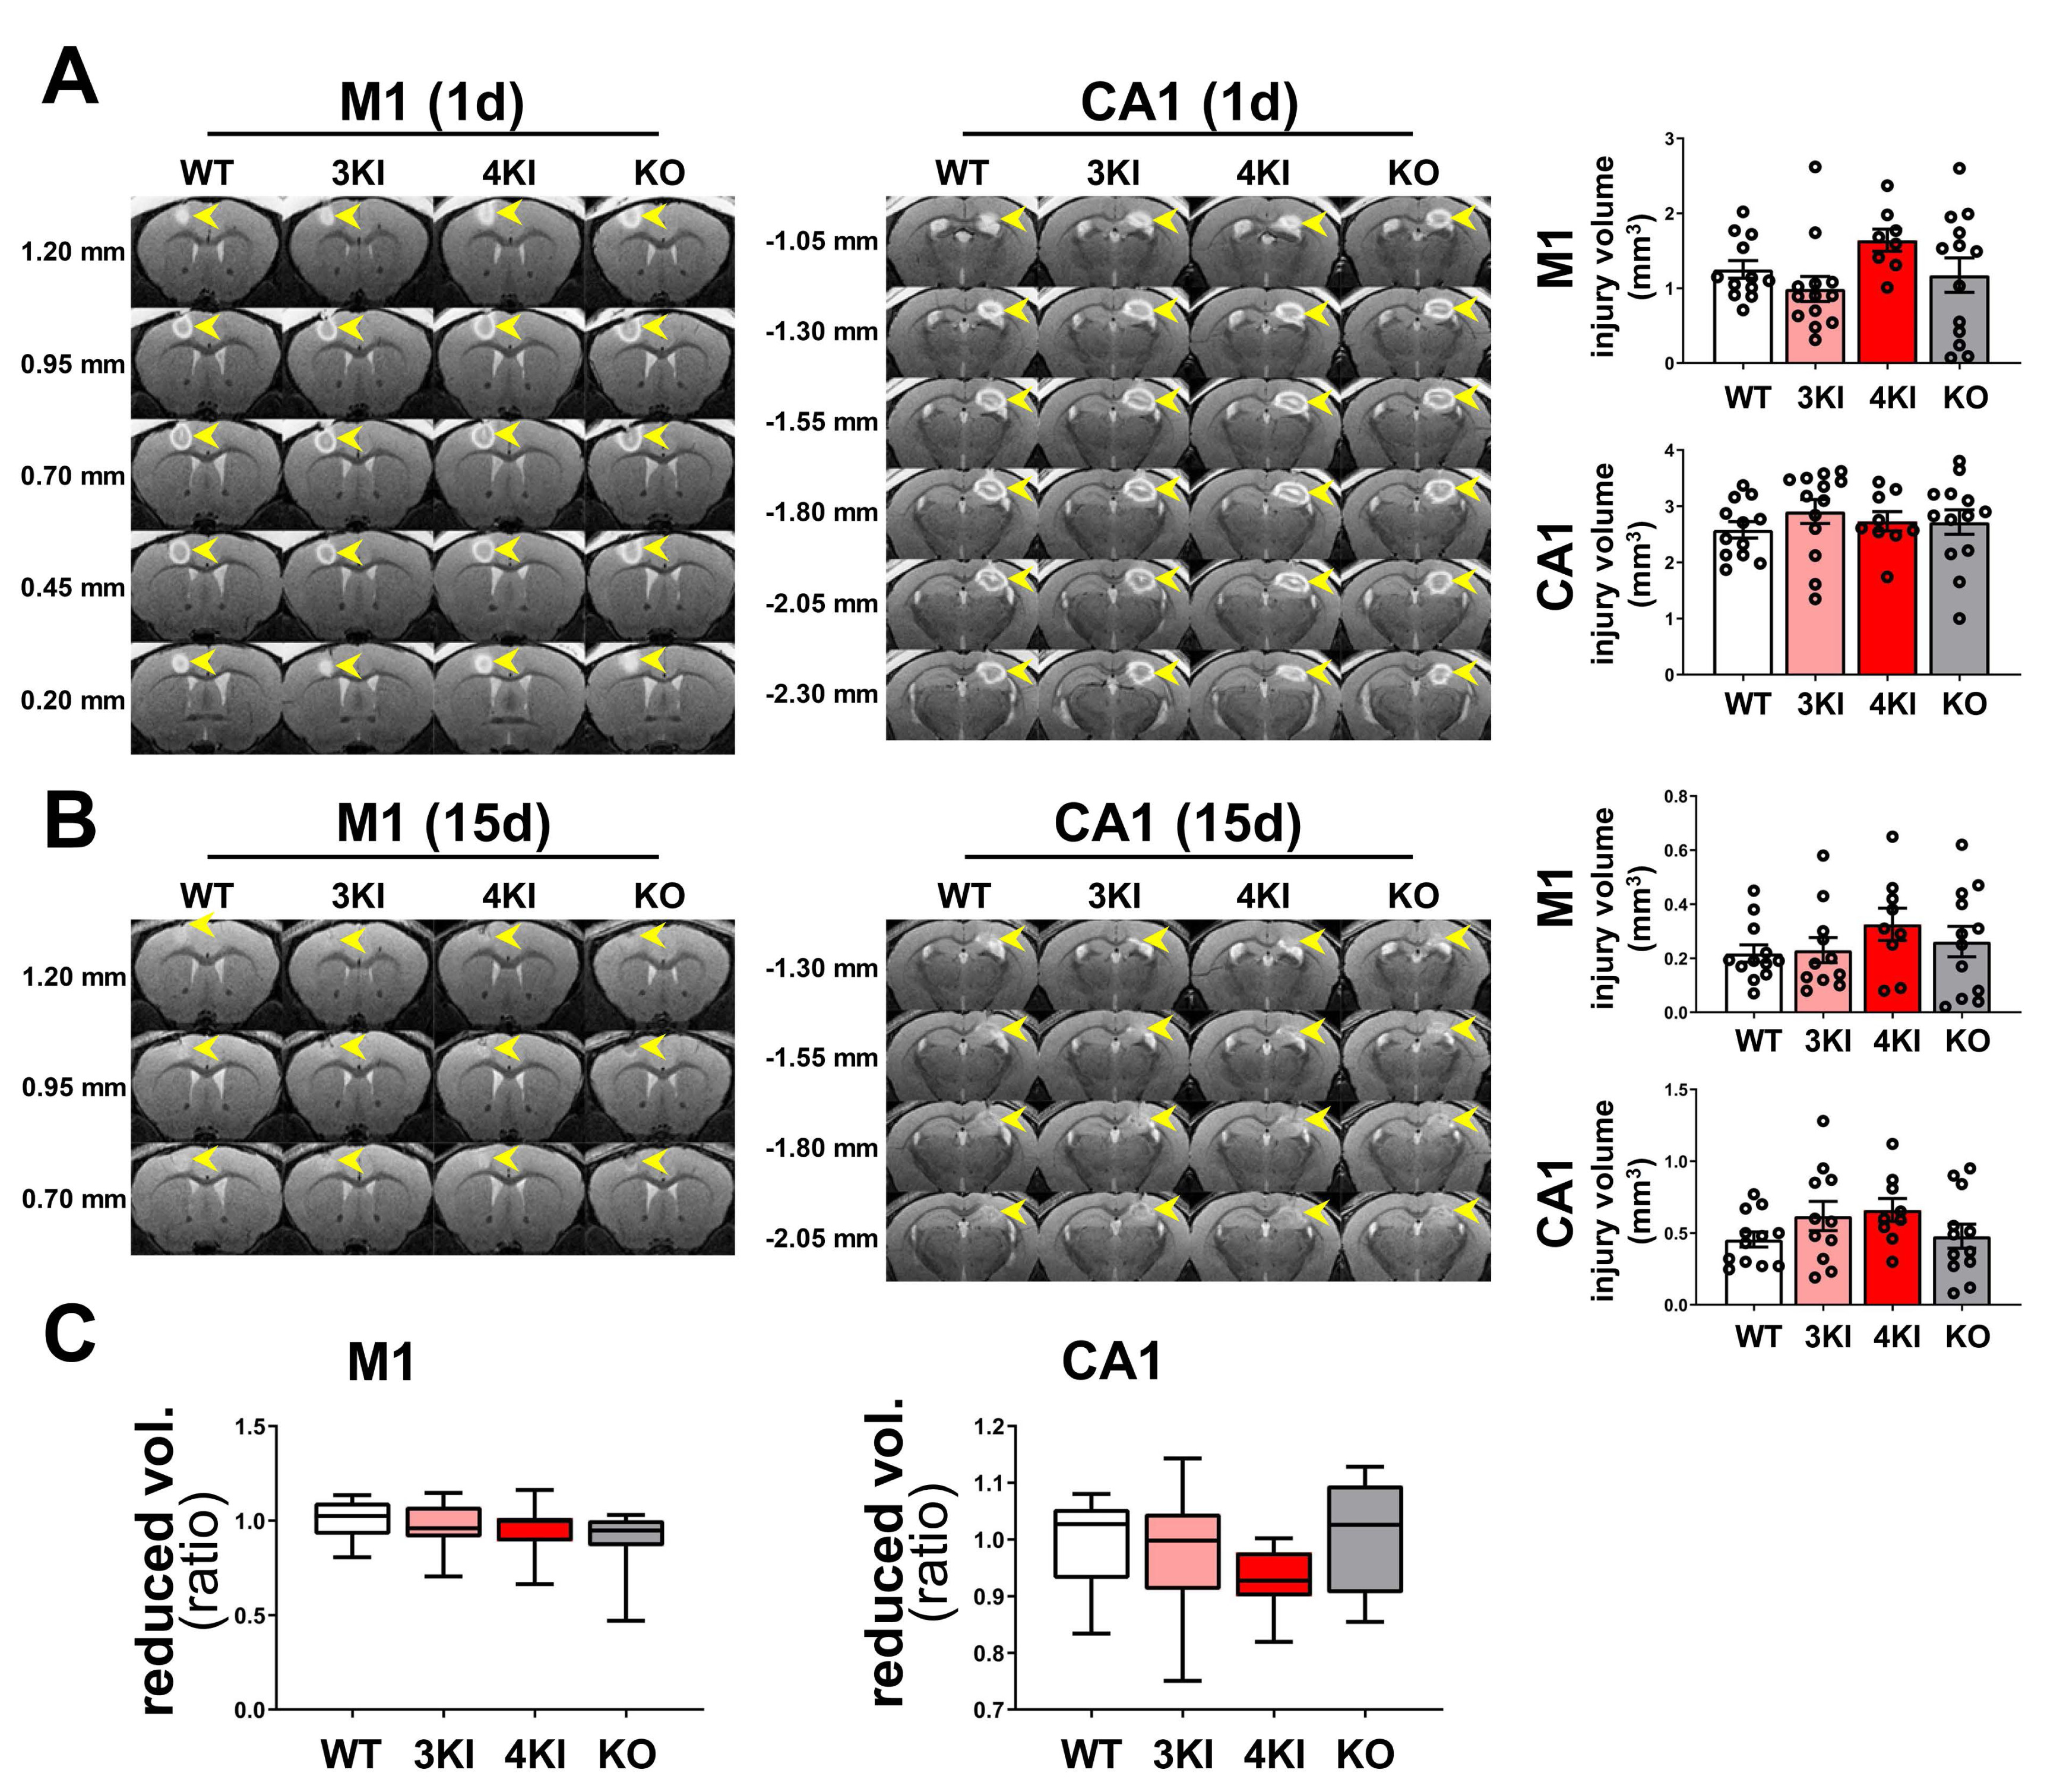
Fig. 2. Focal brain injury and its recovery on brain MRI. (A) MRI on day 1 after ATP injection showed well-demarcated focal injuries in the motor cortex (M1) and hippocampus (CA1) as T2-hyperintense signals (arrowheads). The volumes of injured tissue were comparable among apoE genotypes (all p>0.05). (B) Damaged regions were shrunken and magnetic resonance signals exhibited lower intensity on day 15. The volumes of remaining injuries were similar in all groups (all p>0.05). (C) Damage reduction on day 15, compared with day 1, did not differ in the cortex and hippocampus across all groups (all p>0.05). Bar graphs show means±standard errors of the mean. Box plots show medians and interquartile ranges, while whiskers represent maximum and minimum values. *p<0.05, significant on one-way analysis of variance with post hoc Tukey’s test. 3KI, apoE3 knock-in; 4KI, apoE4 knock-in; KO, knockout; vol, volume; wt, wild-type.
© Exp Neurobiol