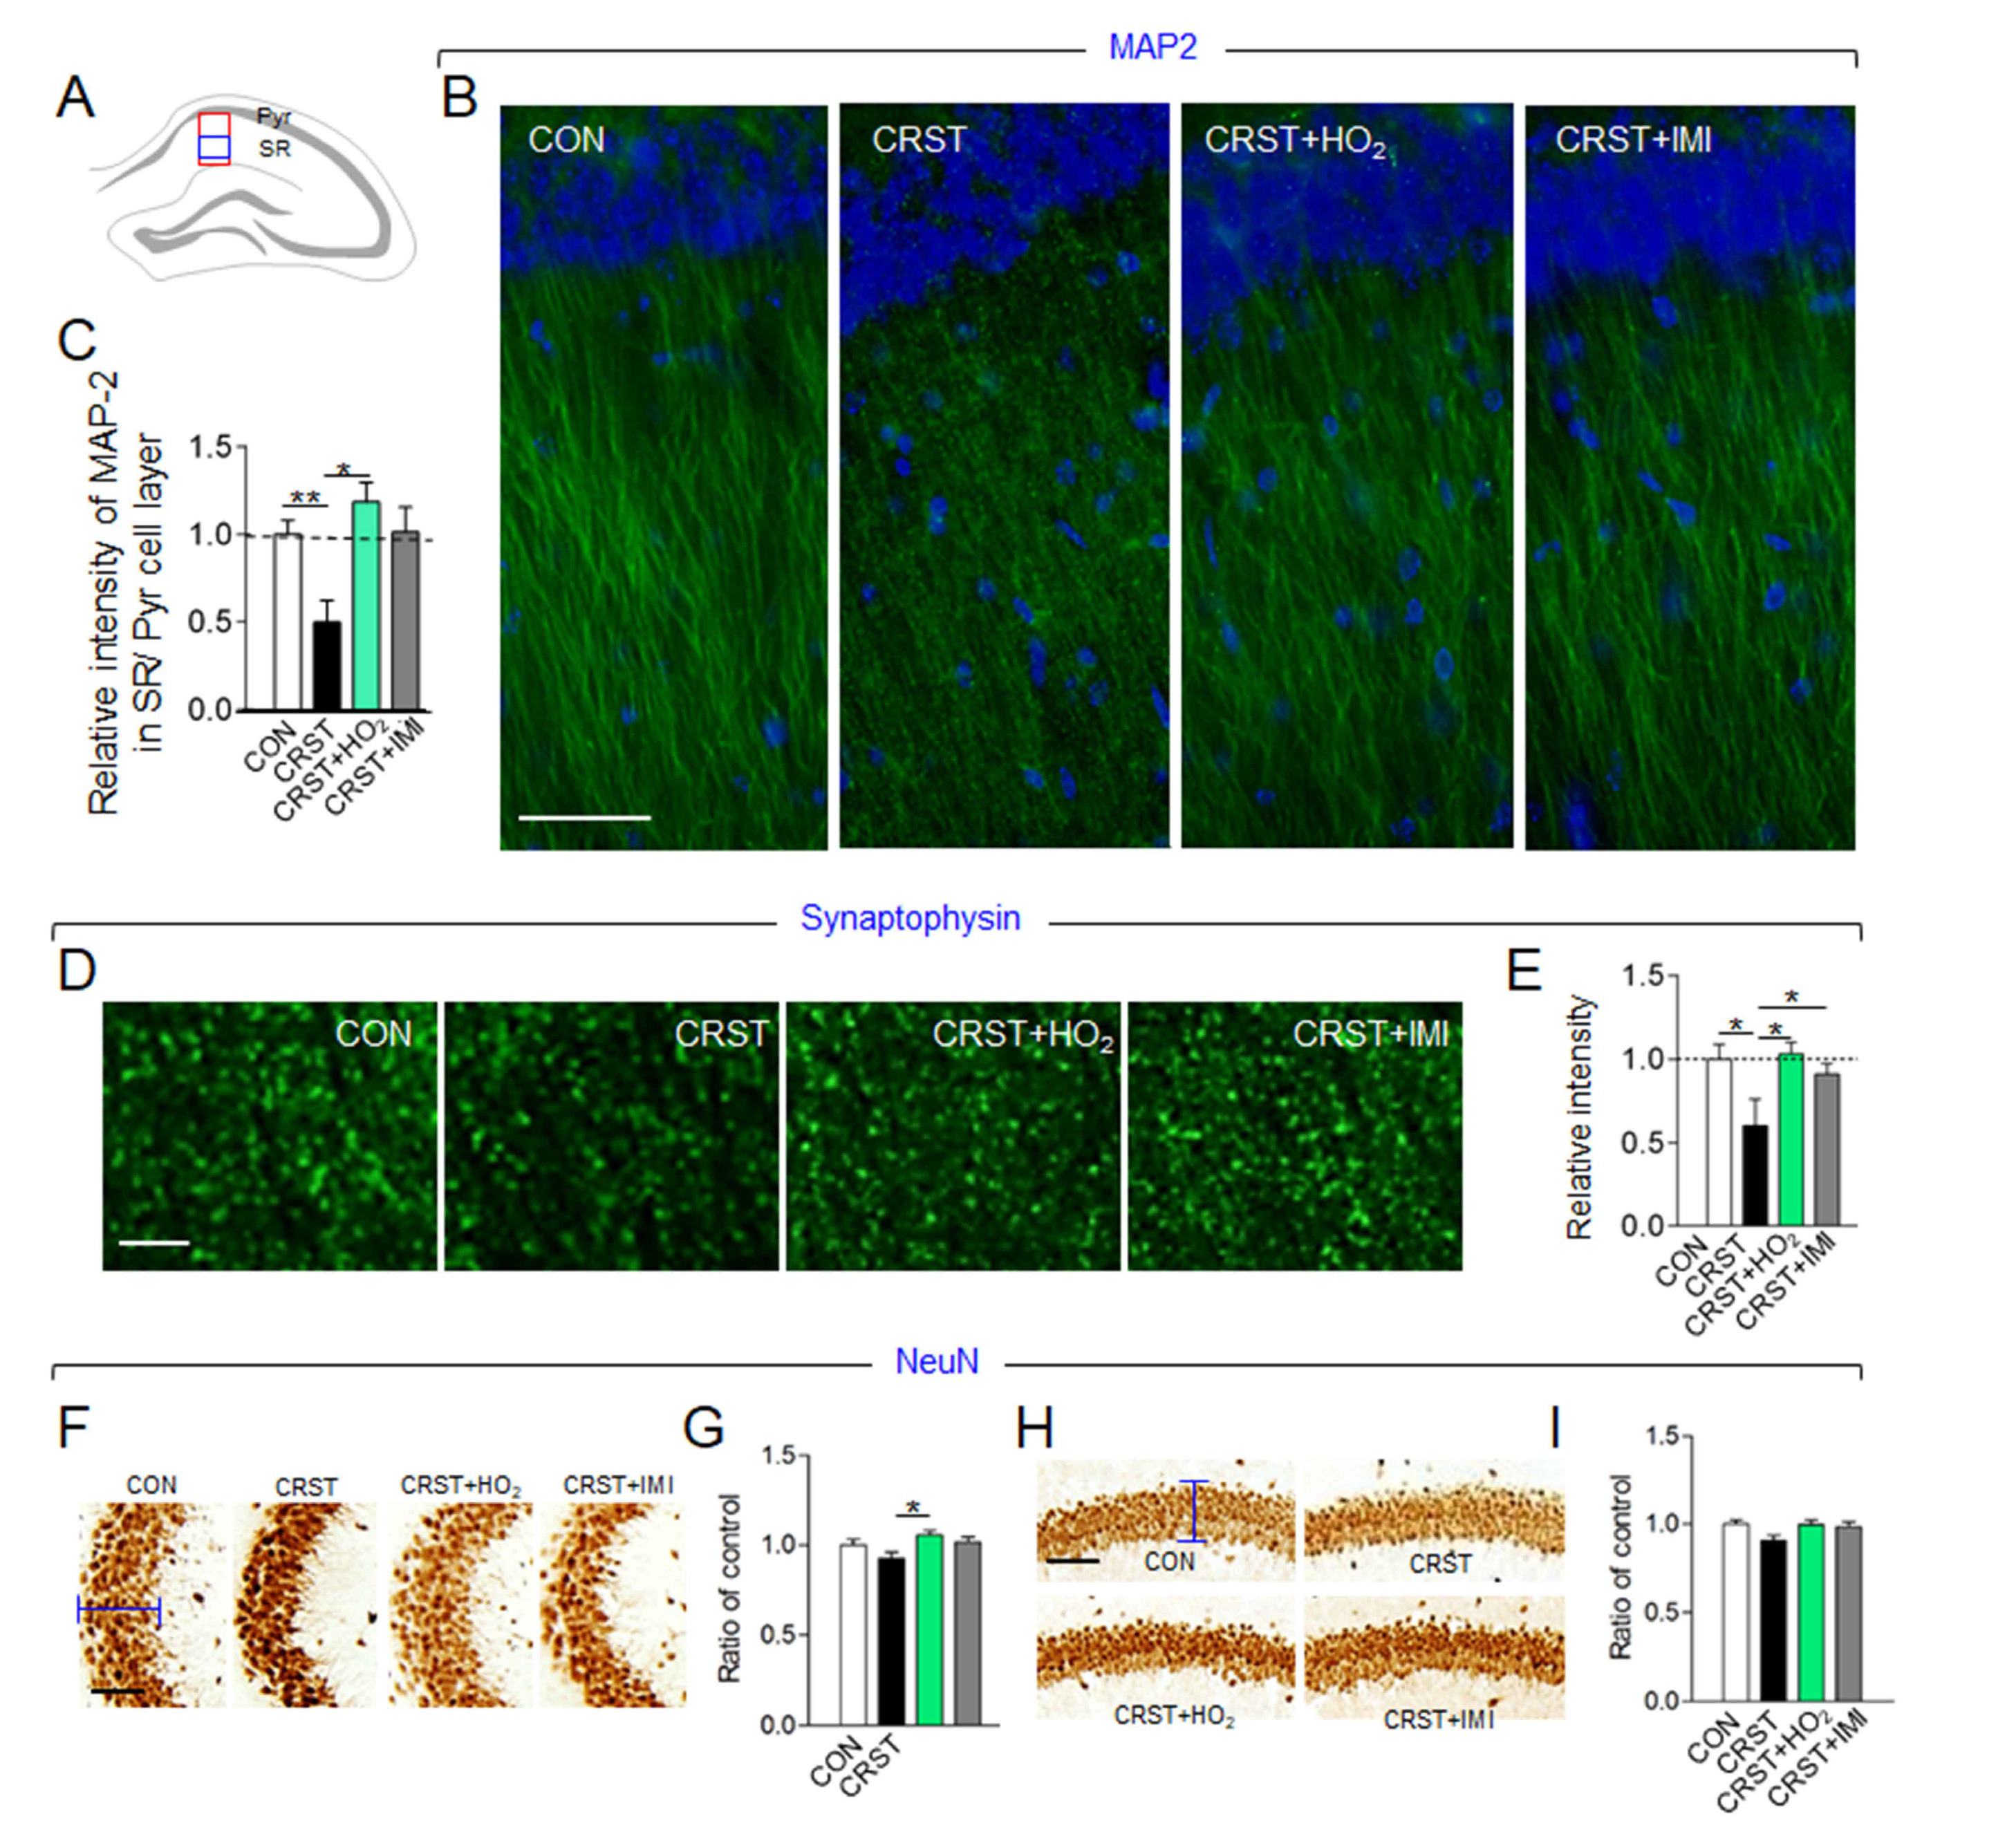
Fig. 6. HO2 treatment rescued stress-induced decreased density of neuritic processes of hippocampal neurons in CRST mice. (A~E) Diagram for the regions examined for immunohistochemical analyses (A). Red box in A is the regions for the images in B, and blue box is for the images in D. Pyr, pyramidal cell layer; SR, stratum radiatum. Photomicrographs showing MAP-2-stained dendritic processes of pyramidal neurons in the SR (B) of the CA1 region of the indicated groups. Scale bar; 50 µm. Quantification levels of the relative intensity of MAP-2-stained dendritic processes in the SR over MAP-2-staining levels in the CA1 pyramidal cell layer (C). Green, MAP-2; Blue, DAPI. Photomicrographs showing synaptophysin-stained puncta in the SR in the hippocampus (D). Scale bar; 40 µm. Quantification levels of synaptophysin staining levels in the SR of the indicated groups (E). n=6 animals per group. (F~I) Photomicrographs showing NeuN-stained pyramidal cell layers in the CA3 (F) and CA1 (H) of the hippocampus of the indicated groups. Quantification levels of the thickness of CA3 (G) and CA1 (I) pyramidal cell layers. Scale bar; 50 µm. n=8 animals per group. Mean±SEM. *,**difference between indicated group. *p<0.05, **p<0.01 (one-way ANOVA and Newman-Keuls post hoc test).
© Exp Neurobiol