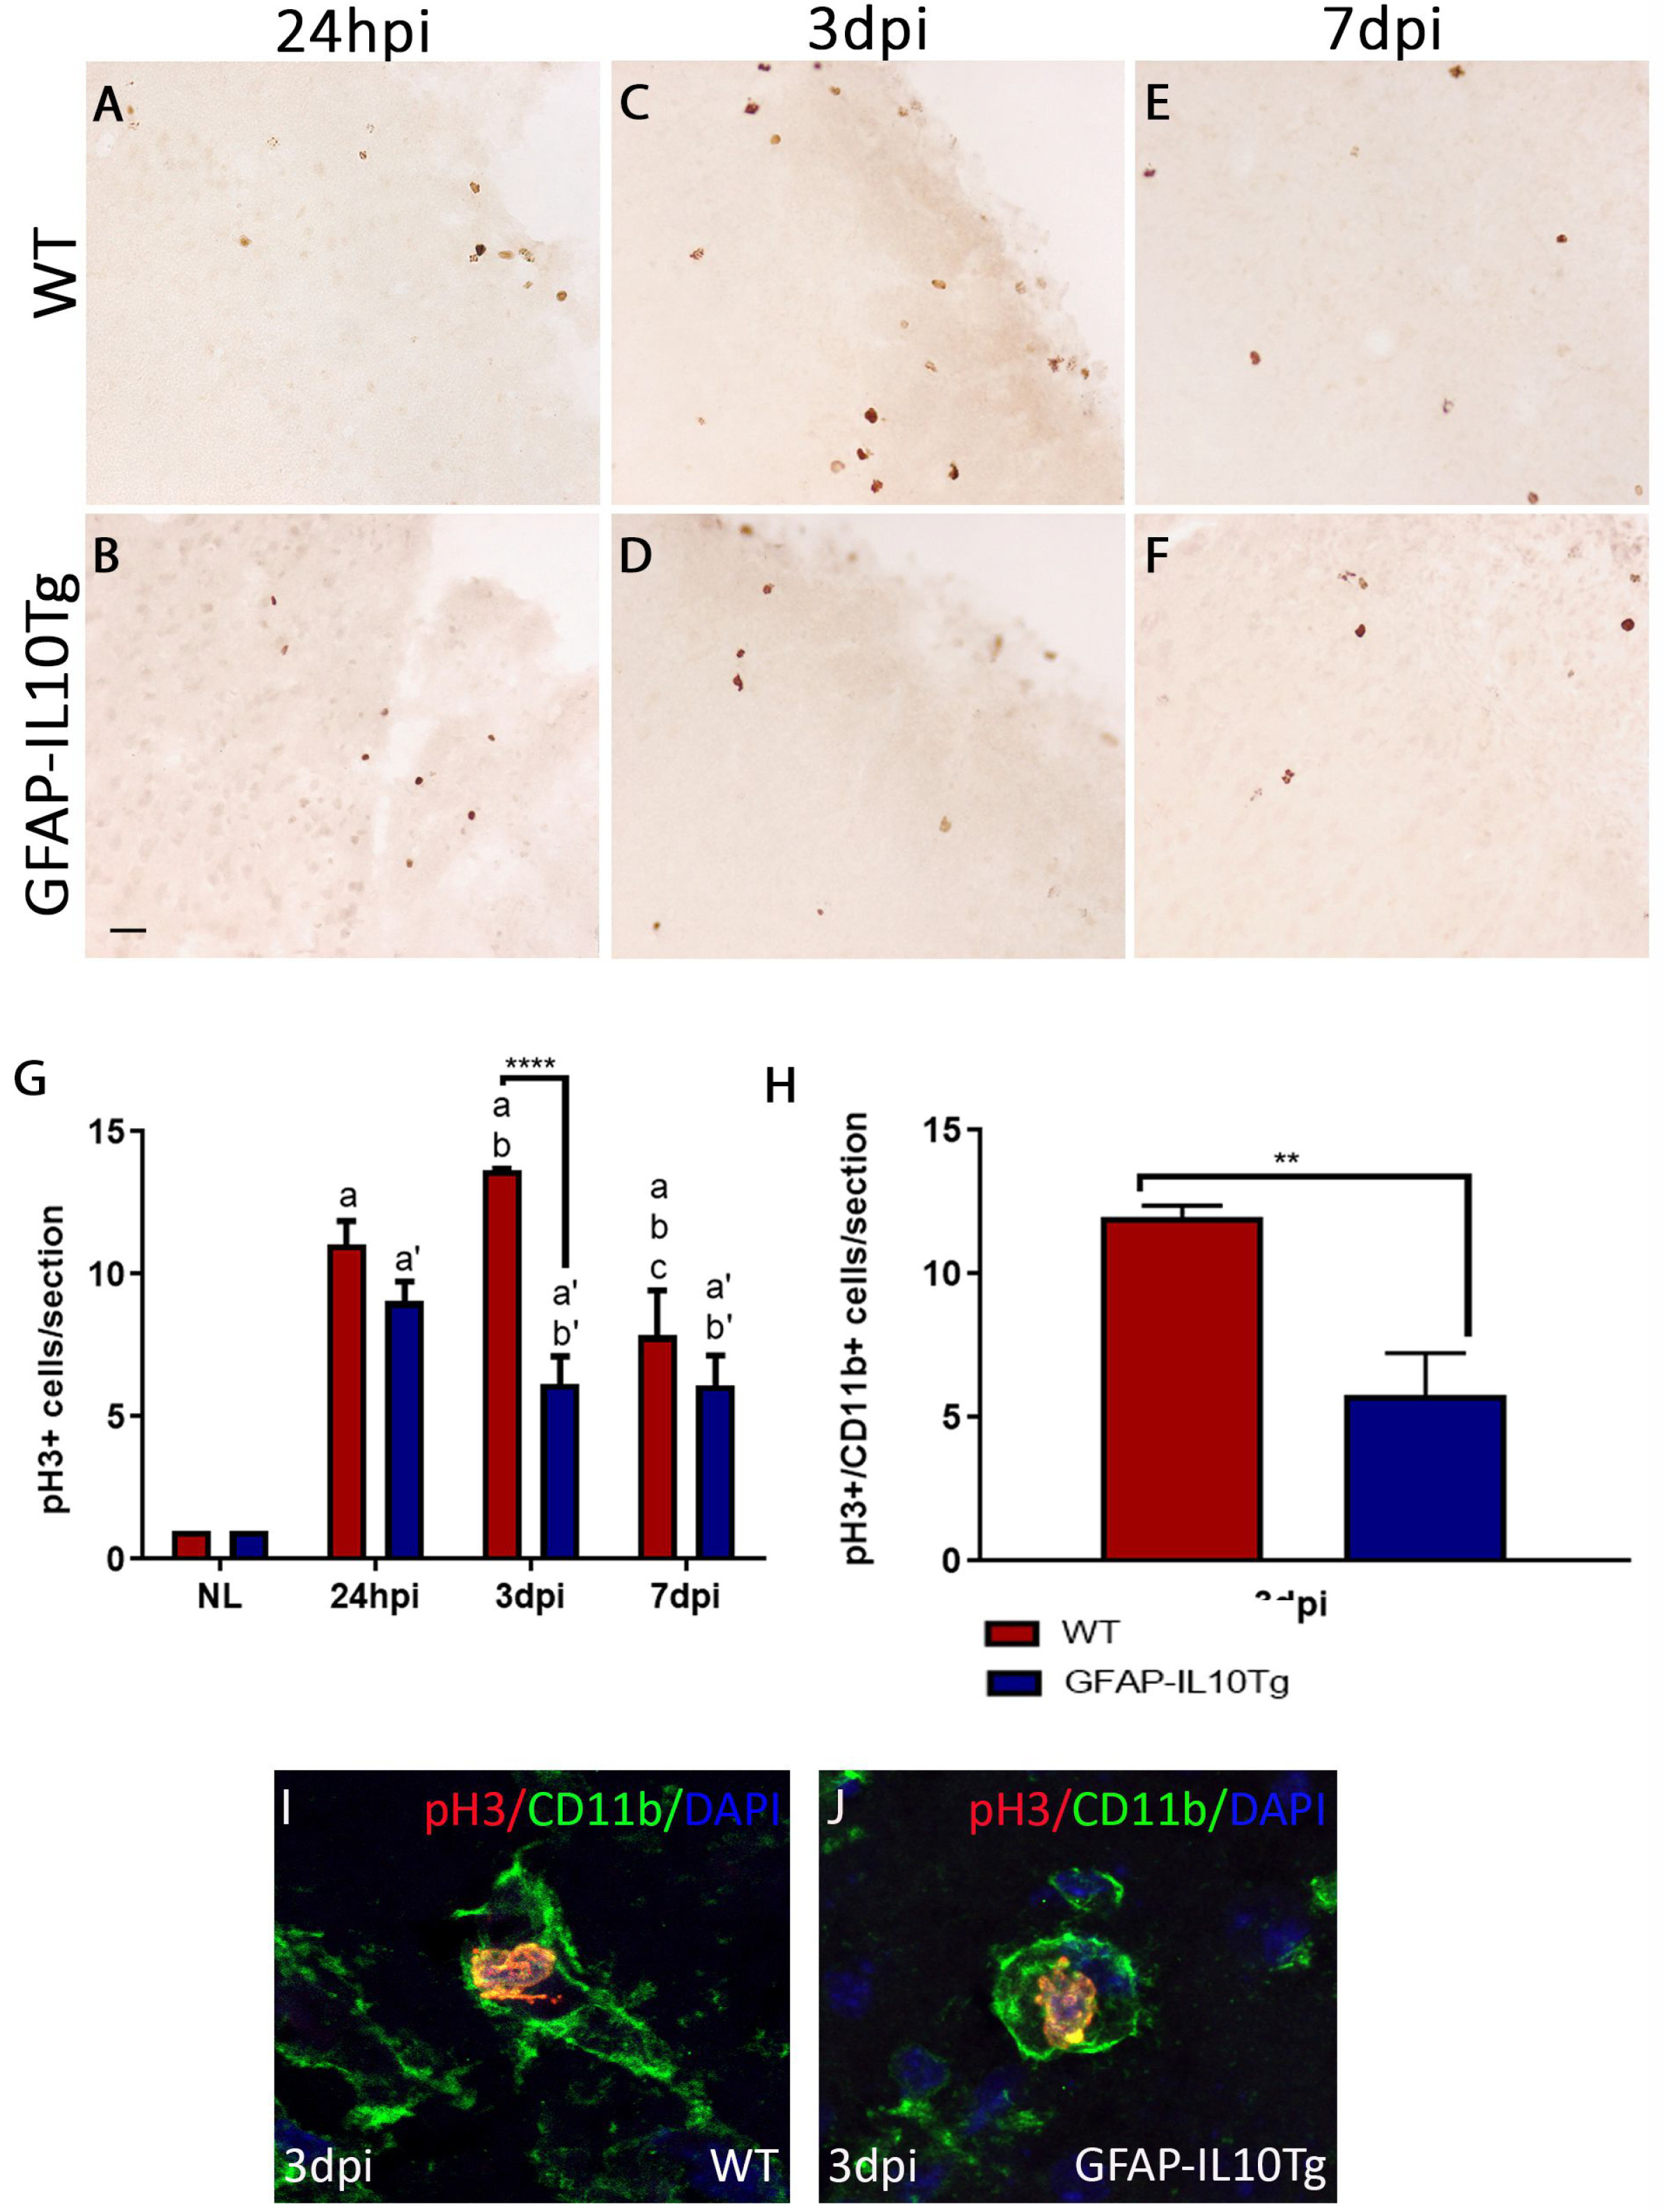
Fig. 7. Microglial/Macrophage proliferation. (A~F) Representative images showing the number of proliferating pH3+ cells in the penumbra of lesioned animals of both WT (A, C, E) and GFAP-IL10Tg animals (B, D, F). (G) Graph showing the quantification of pH3+ cells/section in non-lesioned (NL) and lesioned animals from 24 hpi to 7 dpi in both WT and GFAP-IL10Tg animals. (H) Graph showing the quantification of microglia/macrophage (pH3+/CD11b+) cells/section at 3 dpi in both WT and GFAP-IL10Tg animals. Note that, in GFAP-IL10Tg animals, the number of proliferating microglia/macrophages was significantly low, as compared with WT (**p≤0.01, ****p≤0.0001). (I, J) Representative images of double immunofluorescence of pH3 (red) and CD11b (green) at 3 dpi from WT (I) and GFAP-IL10Tg (J) animals. Nuclei of cells were counterstained with DAPI (blue). All data are represented as mean±SEM. In WT animals: “a” indicates significant vs NL, “b” indicates significant vs 24 hpi, “c” indicates significant vs 3 dpi. In GFAP-IL10Tg animals: “a’” indicates significant vs NL, “b’” indicates significant vs 24 hpi. Scale bar=30 μm.
© Exp Neurobiol