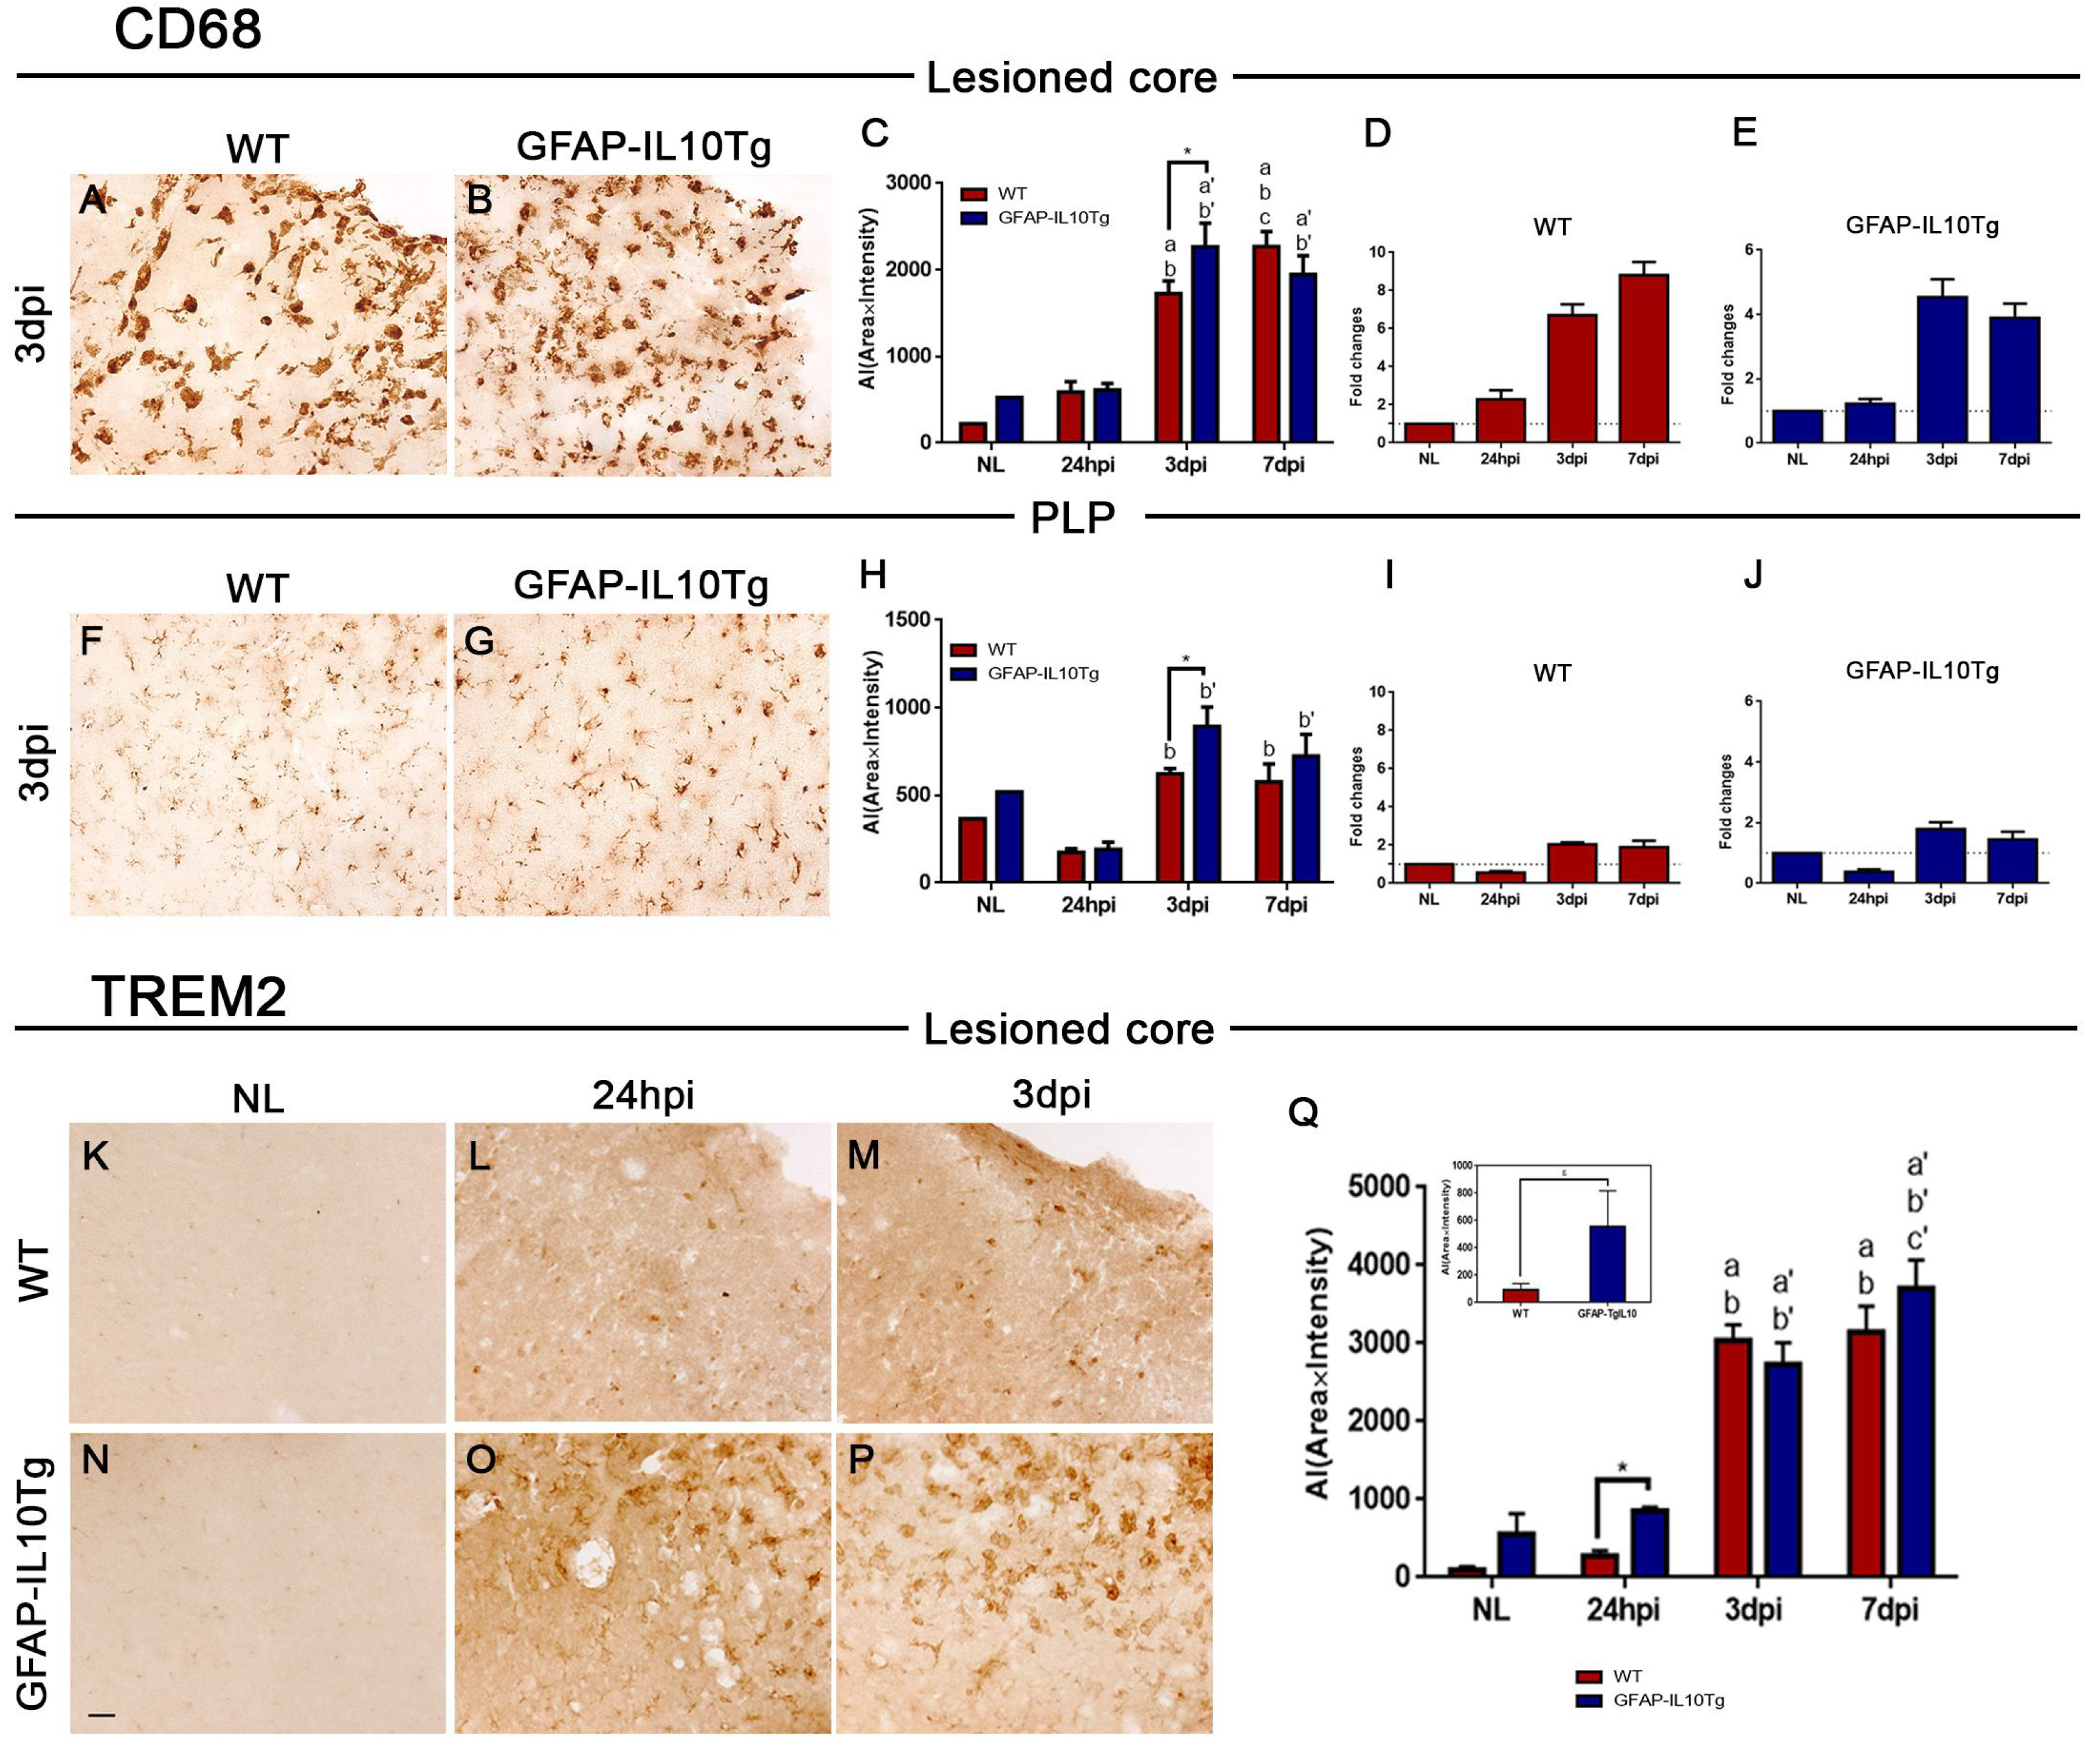
Fig. 8. Phagocytotic microglia. (A, B, F, G) Representative images of CD68 immunolabeling in the lesioned core (A, B) and PLP area (F, G) of WT (A, F) and GFAP-IL10Tg animals (B, G) at 3 dpi. (C, H) Graphs showing the quantification of CD68 immunoreactivity as the AI (Area ˣ Intensity) of both WT and GFAP-IL10Tg in non-lesioned (NL), lesioned core (C) and PLP part (H) in lesioned animals from 24 hpi to 7 dpi. Note that GFAP-IL10Tg animals showed higher expression of CD68 at 3 dpi in both areas. (D, E, I, J) Graphs showing the fold changes of CD68 expression in comparison to the respective NL animals in WT (D, I) and GFAP-IL10Tg animals (E, J) in the lesioned core and PLP. GFAP-IL10Tg animals showed a significant, lower fold increase of CD68 than did WT in both lesioned core and PLP. (K~P) Representative images of TREM2 immunoreactivity in both the non-lesioned (NL) (K, N) and lesioned core of TBI-injured mice at 24 hpi (L, O) and 3 dpi (M, P) in WT (L, M) and GFAP-IL10Tg groups (O, P). (Q) Graph showing the quantification of TREM2 immunoreactivity as the AI (Area ˣ Intensity) in non-lesioned (NL) and at the lesioned core of lesioned animals from 24 hpi to 7 dpi. Note that GFAP-IL10Tg animals showed higher expression of TREM2 in NL animals (inset in Q) and at 24 hpi in the lesioned area. All values are represented as mean±SEM (εp≤0.1, *p≤0.05). In WT animals: “a” indicates significant vs NL, “b” indicates significant vs 24 hpi, “c” indicates significant vs 3 dpi. In GFAP-IL10Tg animals: “a’” indicates significant vs NL, “b’” indicates significant vs 24 hpi, “c’” indicates significant vs 3 dpi.
© Exp Neurobiol