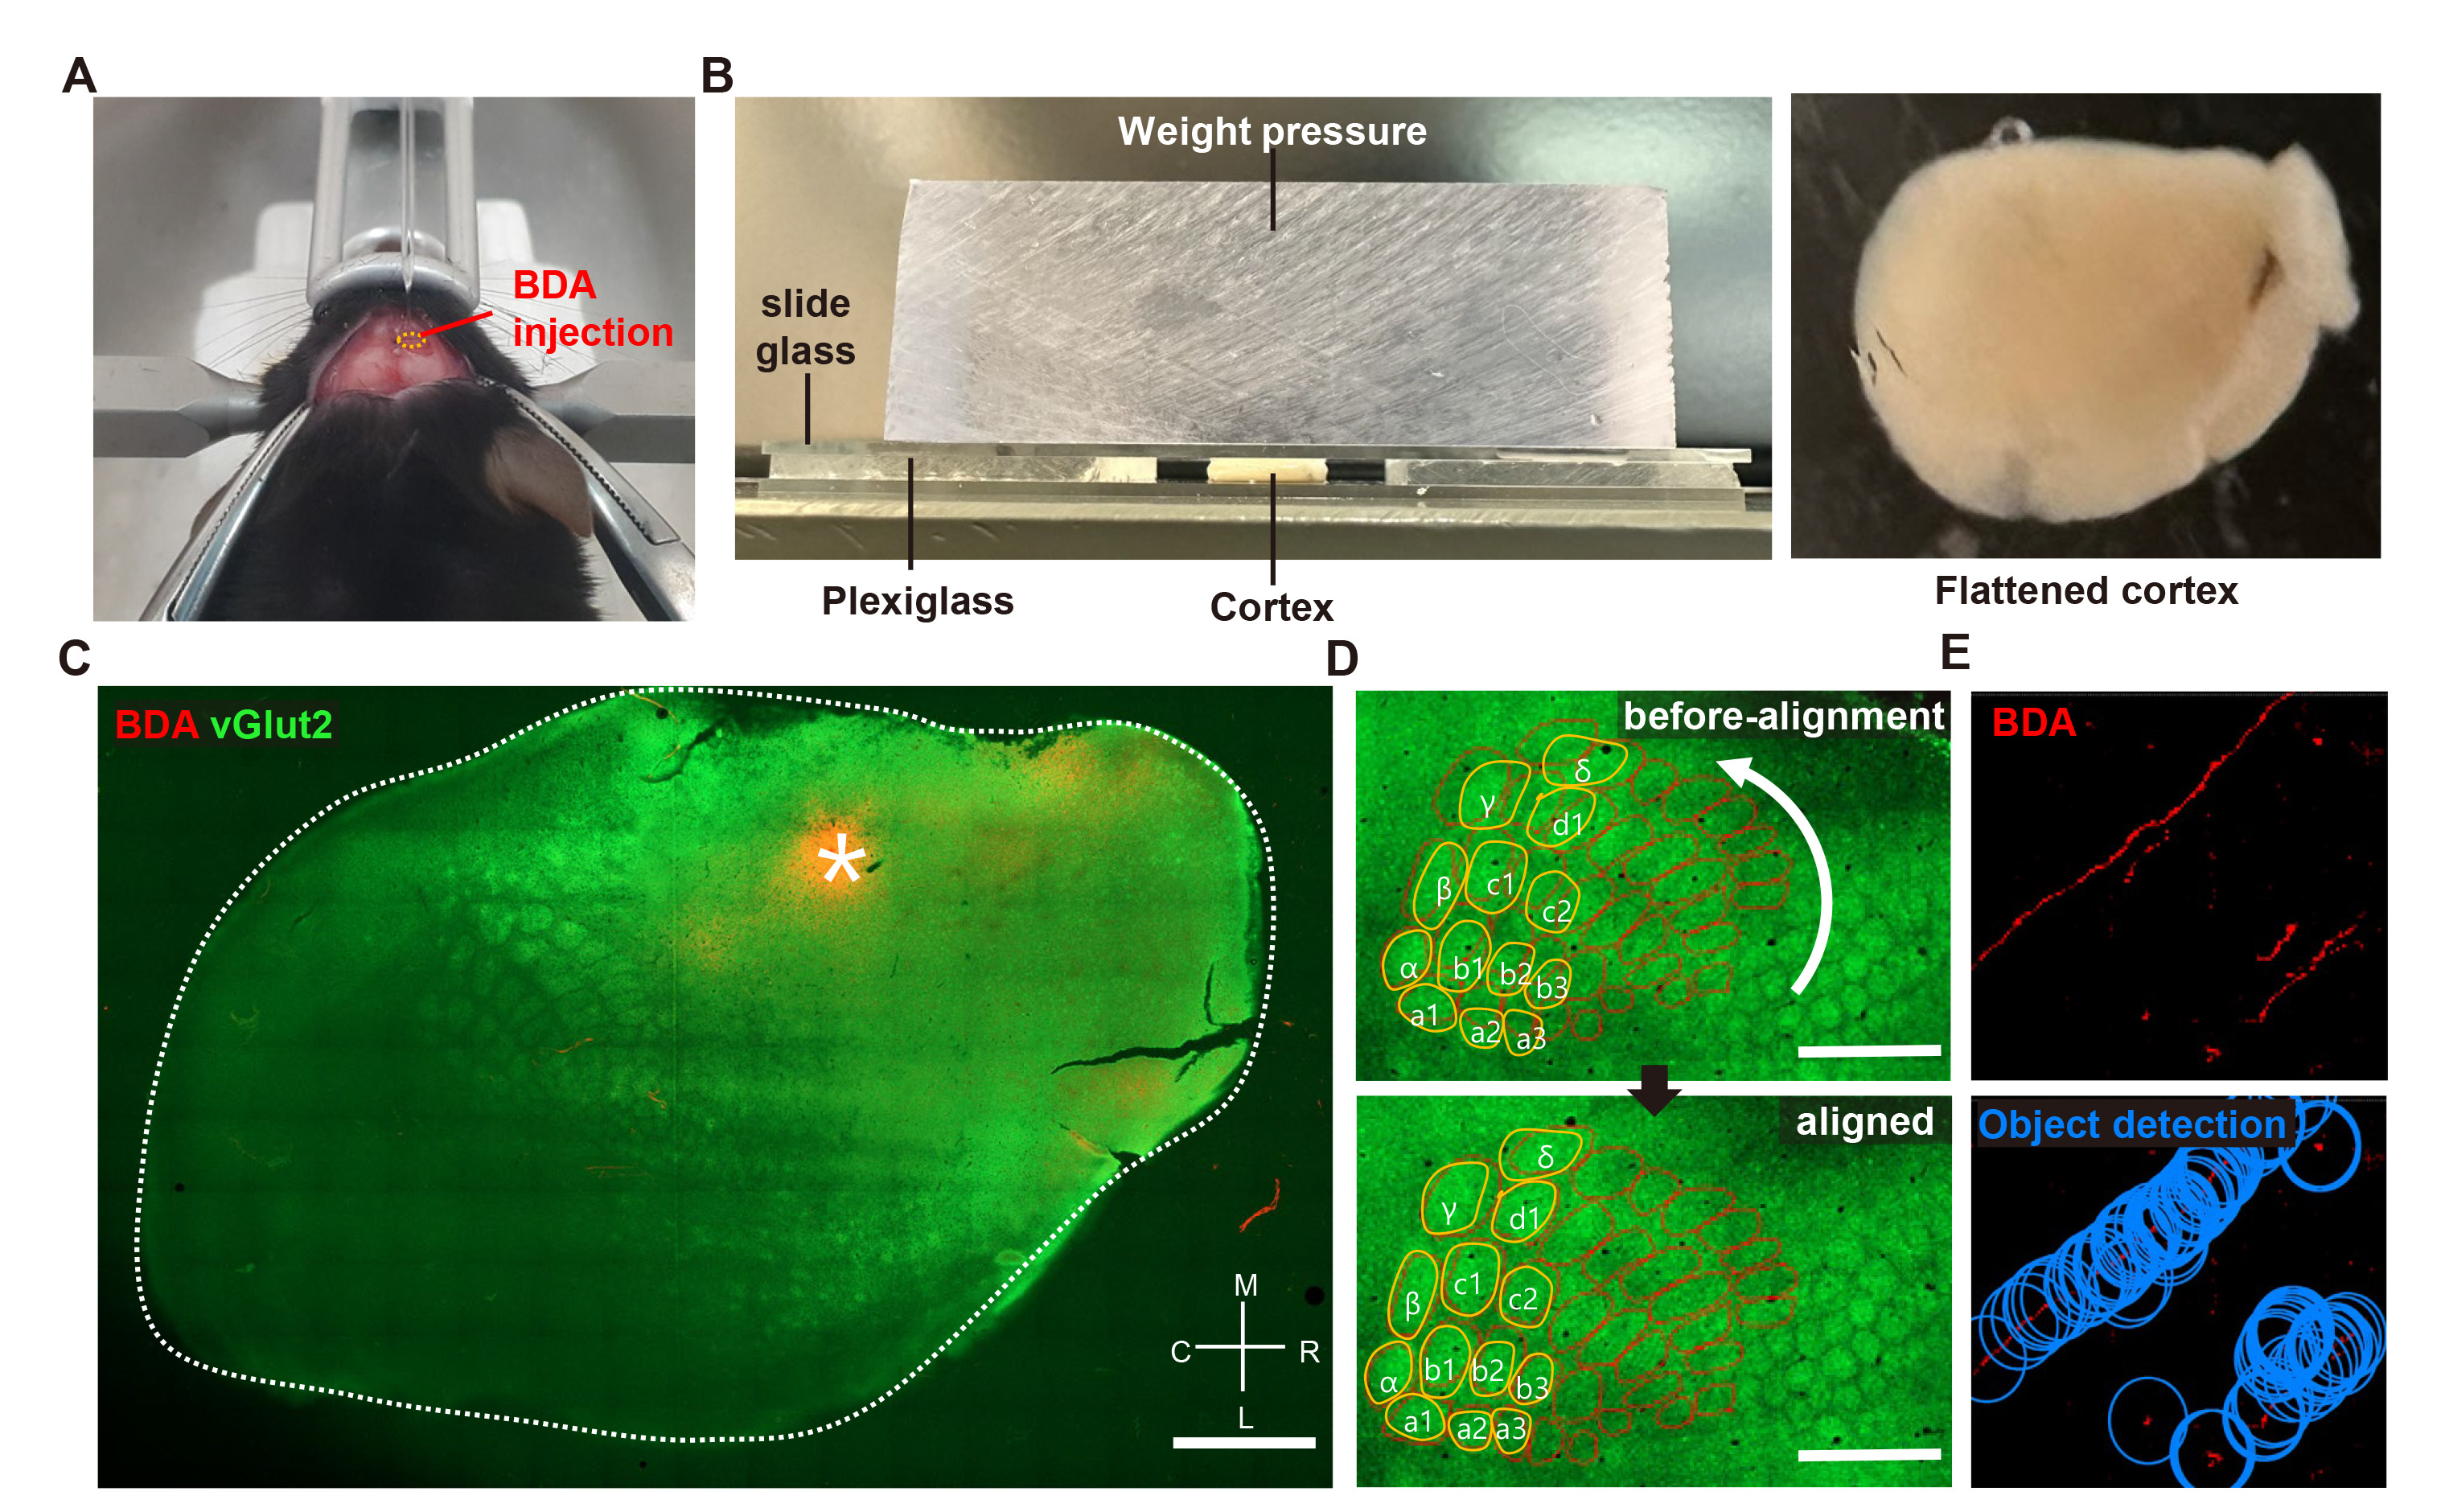
Fig. 2. Image acquisition of BDA-traced axons and extraction of the Cartesian coordinates from digitized axonal signals. (A) A representative picture of cortical biotinylated dextran amine (BDA) injection. Small burr hole (orange dotted line) was made on premotor cortex, and BDA was delivered through pulled-capillary glass. (B) Custom plexiglass setting for tissue flattening (left). Cortices were placed in between two slide glasses with 2 mm thick of plexiglass to ensure the flattened tissue thickness. Weight pressure was place on top of it to give constant pressure. Flattened cortex after flattening process (right). (C) Representative flattened tissue section image following labeling of vesicular-glutamate transporter 2 (vGLUT2) and BDA. BDA injection site was marked by asterisk. Whole tissue was outline by white dotted line. Scale bar=1000 μm. Axis of tissue section is indicated on bottom-right of image. M: medial, R: rostral, L : lateral, C: caudal. (D) Tissue alignment of vGLUT2 labeled barrel cortex. Manually contoured barrel cortex (red solid line), another tissue’s barrel cortex (orange solid line) was aligned to fit together. Scale bar=500 μm. (E) BDA positive signals (top) were marked with blue round shape markers (bottom) by mark object function embedded in StereoInvestigator software. Each marker location was transposed into Cartesian coordinates.
© Exp Neurobiol