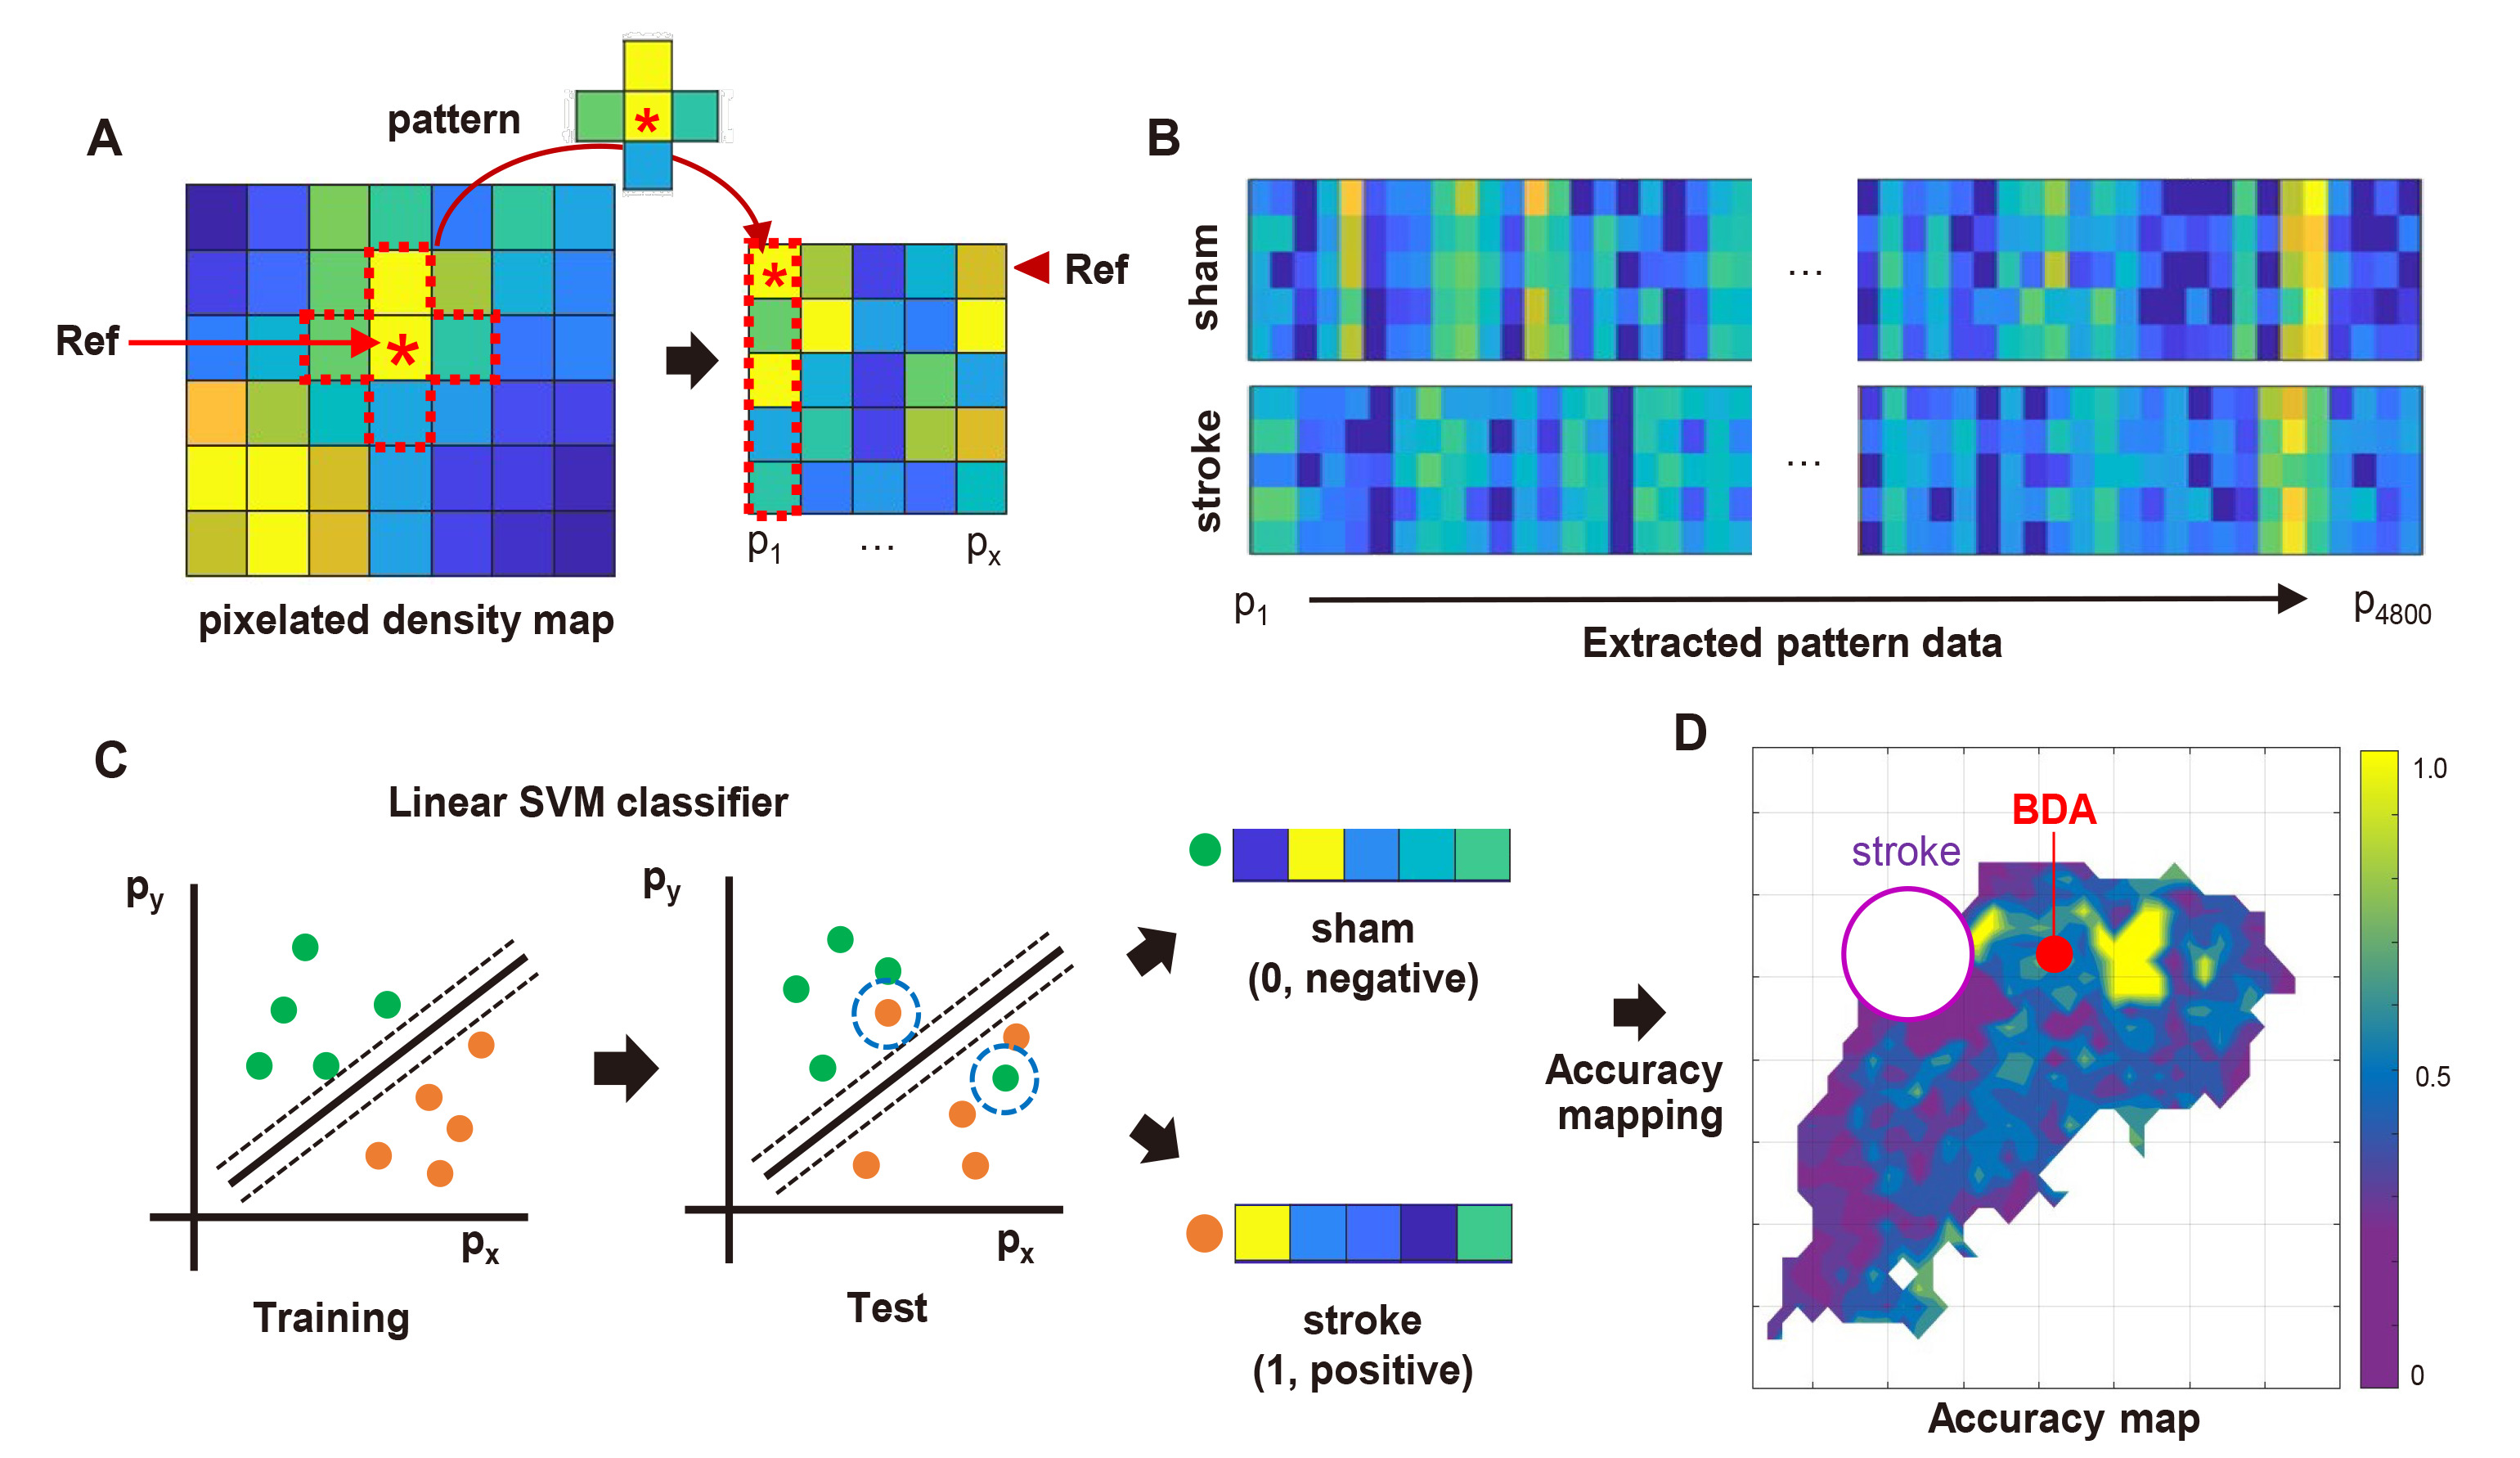
Fig. 3. Machine learning algorithm for analysis of axon density distribution pattern. (A) Schematic explanation of pattern extraction. From pixelated density map, 5 pixels were extracted as pattern data (red dotted line) from the randomly visited reference pixel (asterisk). (B) This process was repeated through whole pixelated density map to obtain all pattern data sets from each group. (C) Linear support vector machine (SVM) classifier was trained using extracted pattern data and classified test data based on hyperplane (solid line) set in training session with designated margin (dotted line), distinguishing each pattern into sham or stroke group. (D) Classifier accuracy map was plotted after calculation of individual pixel accuracy.
© Exp Neurobiol