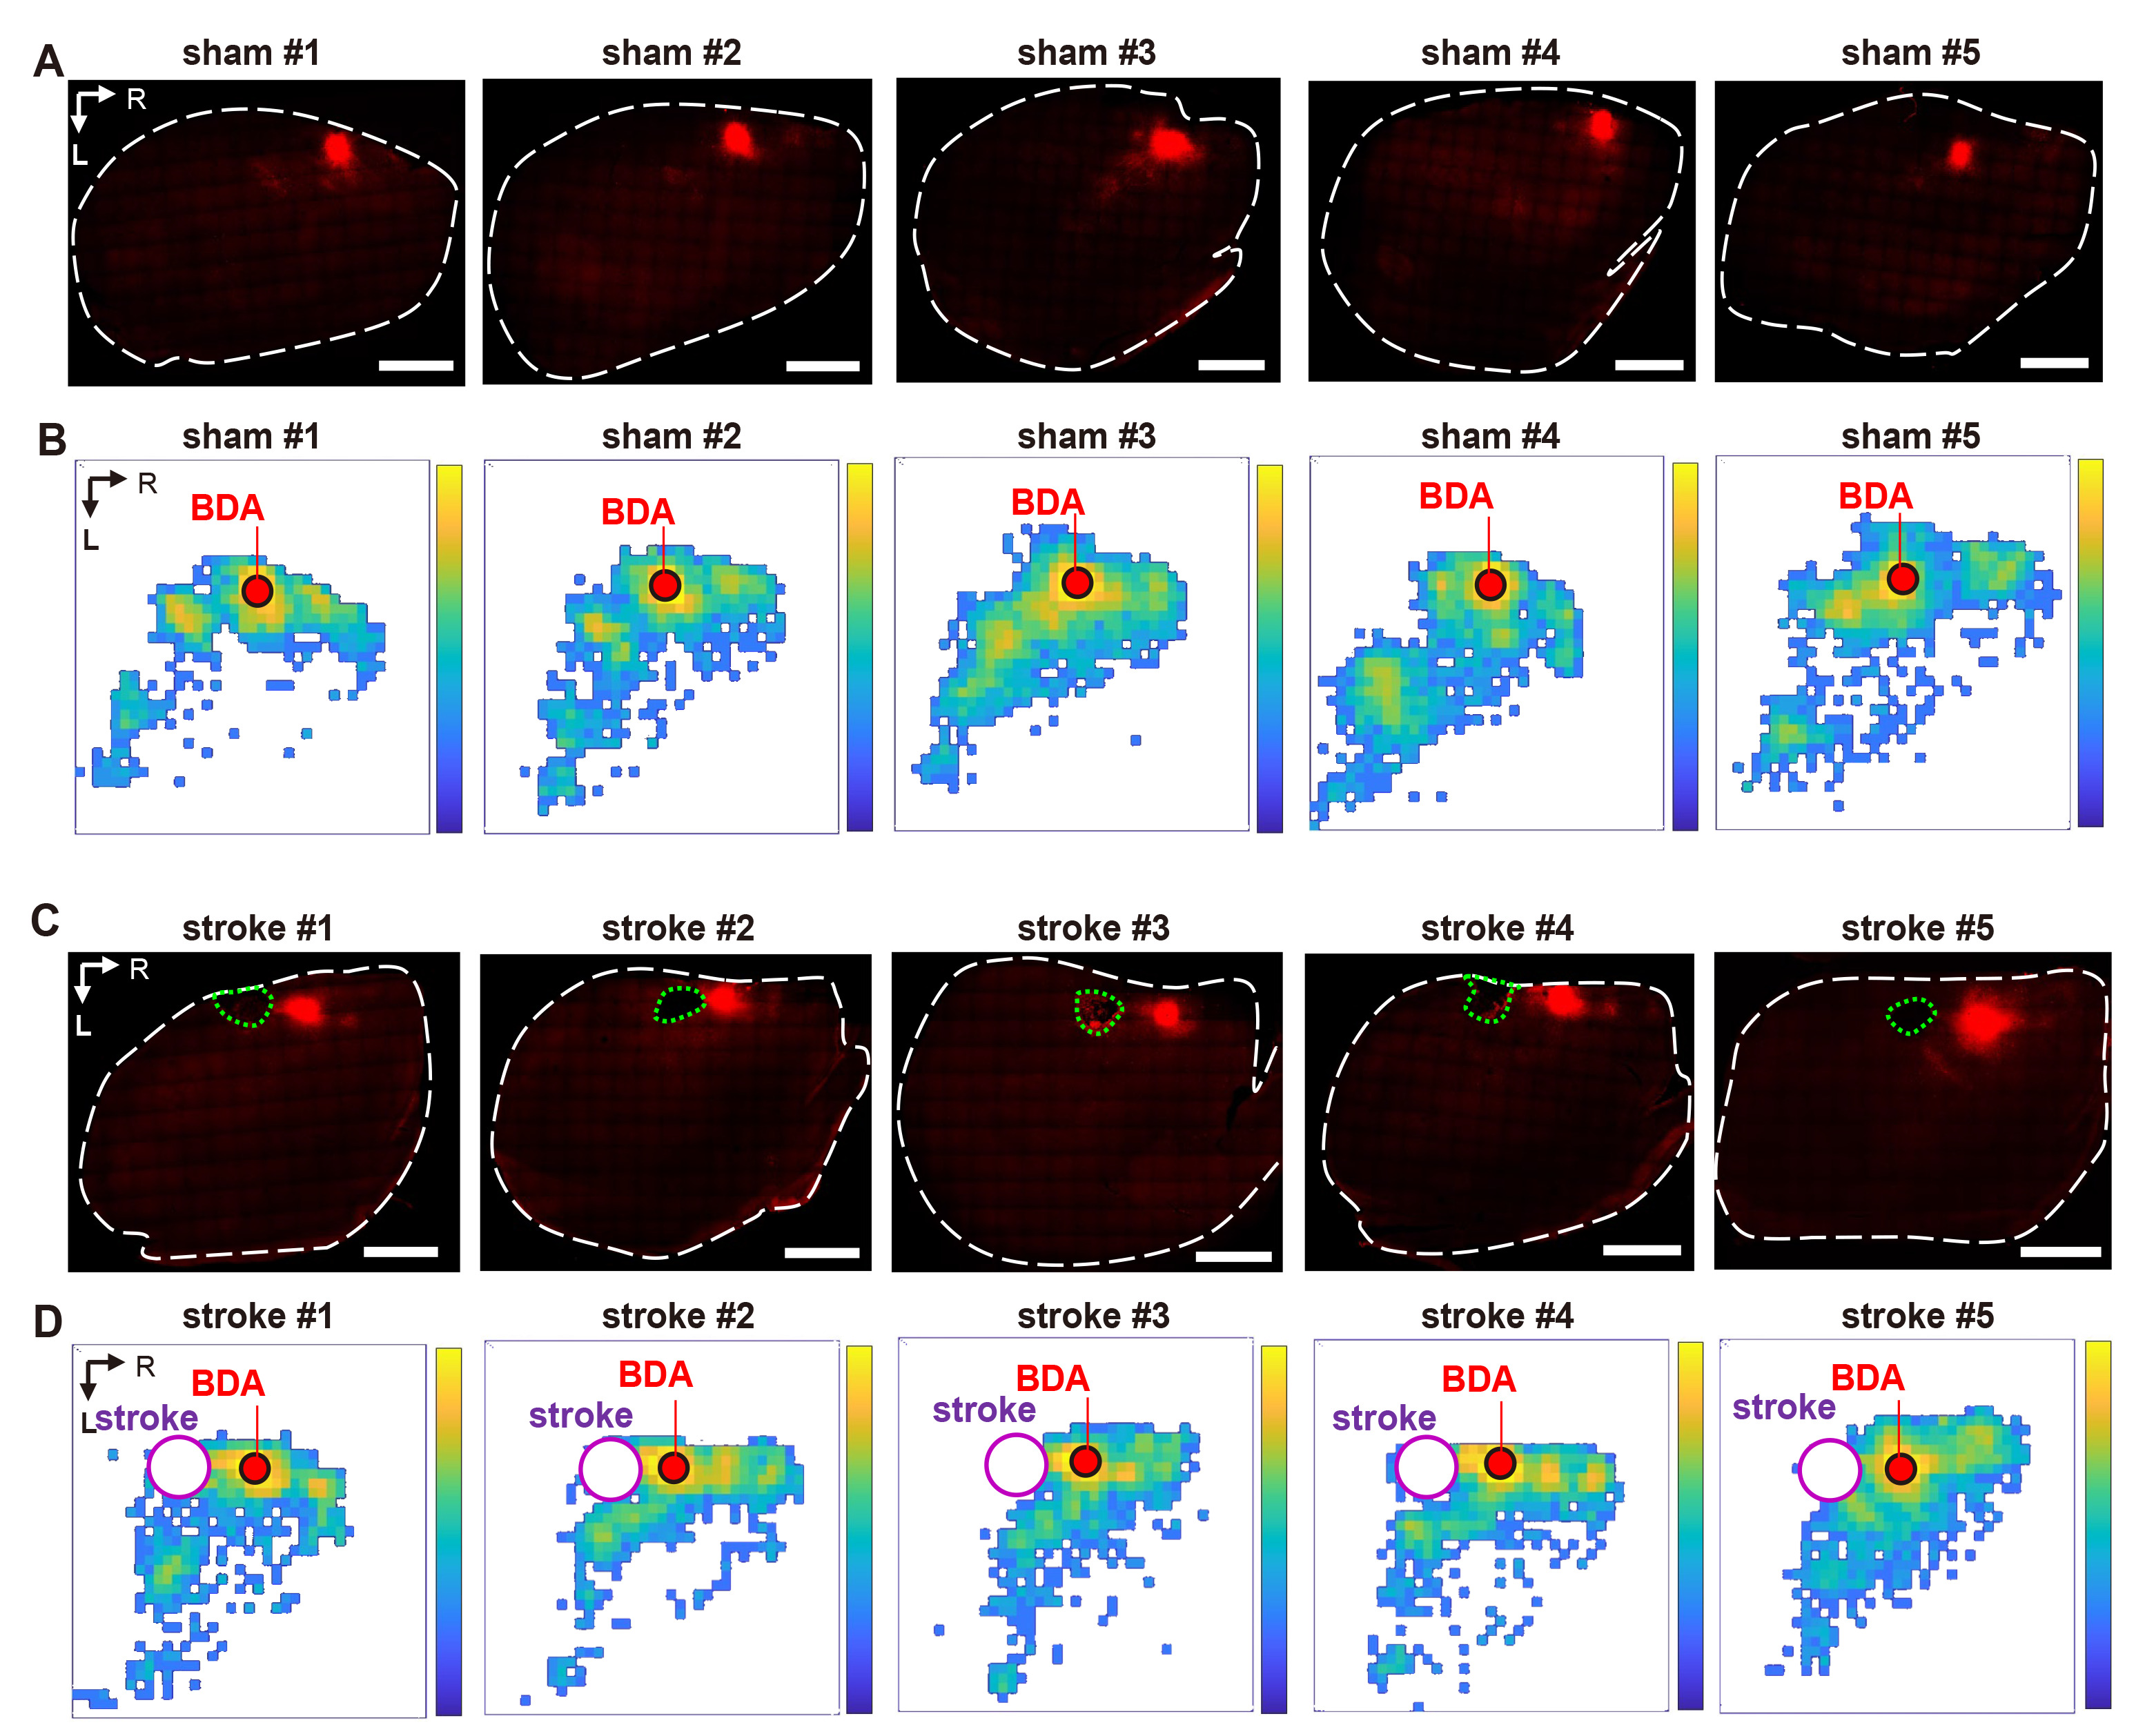
Fig. 4. Conversion of the histological BDA axon signals to the pixelated axon density map. (A) Biotinylated dextran amine (BDA) labeled tangential tissue images of individual subjects of sham groups. Scale bar=1500 μm. (B) Pixelated BDA density map of individual sham group subjects. (C) BDA labeled tangential tissue images of stroke groups. Scale bar=1500 μm. (D) Pixelated BDA density map of individual stroke subjects. Whole tissues (white dotted line) or infarction area (green dotted line) was outlined. Tissue axis is indicated at the left top corner (R: rostral, L: lateral).
© Exp Neurobiol