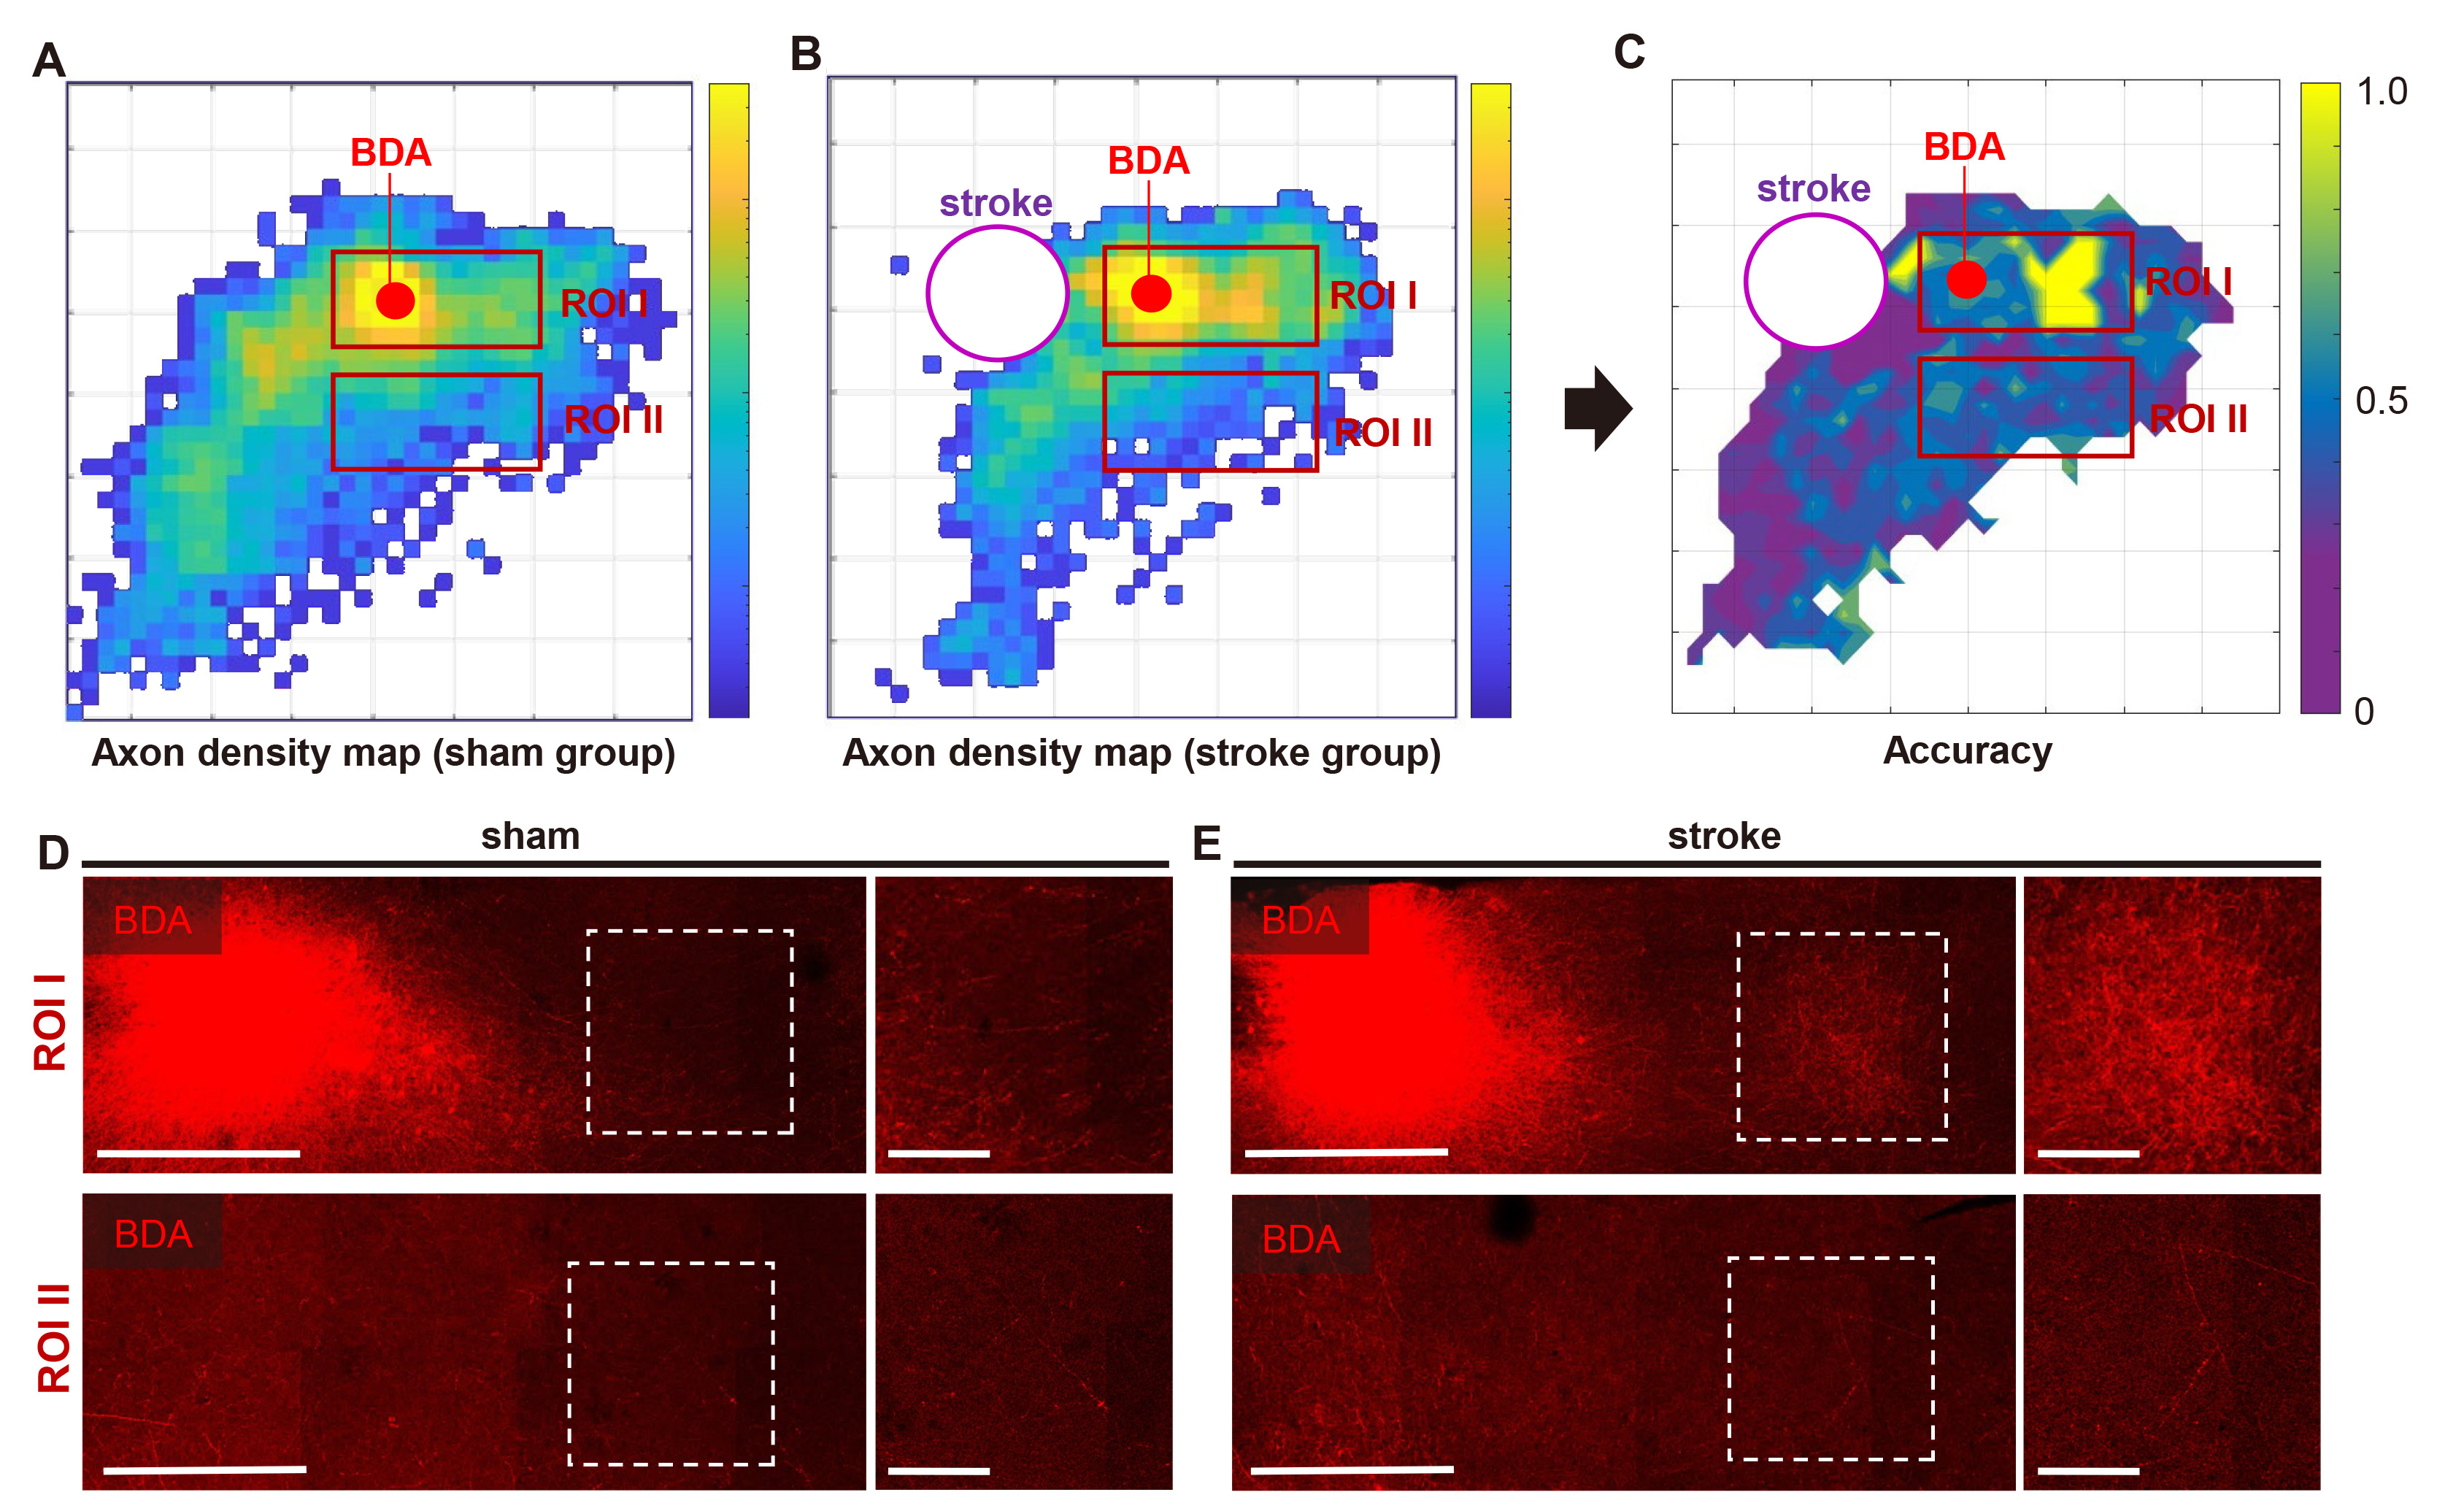
Fig. 5. Comparison of BDA labeled axon sprouting using machine learning-based pattern analysis. (A, B) Mean axon density map of sham, and stroke group. Pattern data set extracted from mean axon density map were classified by support vector machine (SVM) classifier. (C) Calculated individual pixel accuracy was plotted. Color-coded accuracy map showed high accuracy area that has distinguishable pattern difference. (D) Biotinylated dextran amine (BDA) labeled axon images in high accuracy region of interest (ROI I) and low accuracy ROI II of sham group. Right panel is enlarged images of white dotted square. Scale bar=500 μm (left), 200 μm (right). (E) BDA labeled axon images in high accuracy (ROI I) and low accuracy (ROI II) in stroke group. Scale bar=500 μm (left), 200 μm (right). White dotted square was enlarged on the right. In high accuracy ROI I showed increased BDA labeled axons, while ROI II showed no difference in sham and stroke groups with relatively low density of BDA.
© Exp Neurobiol