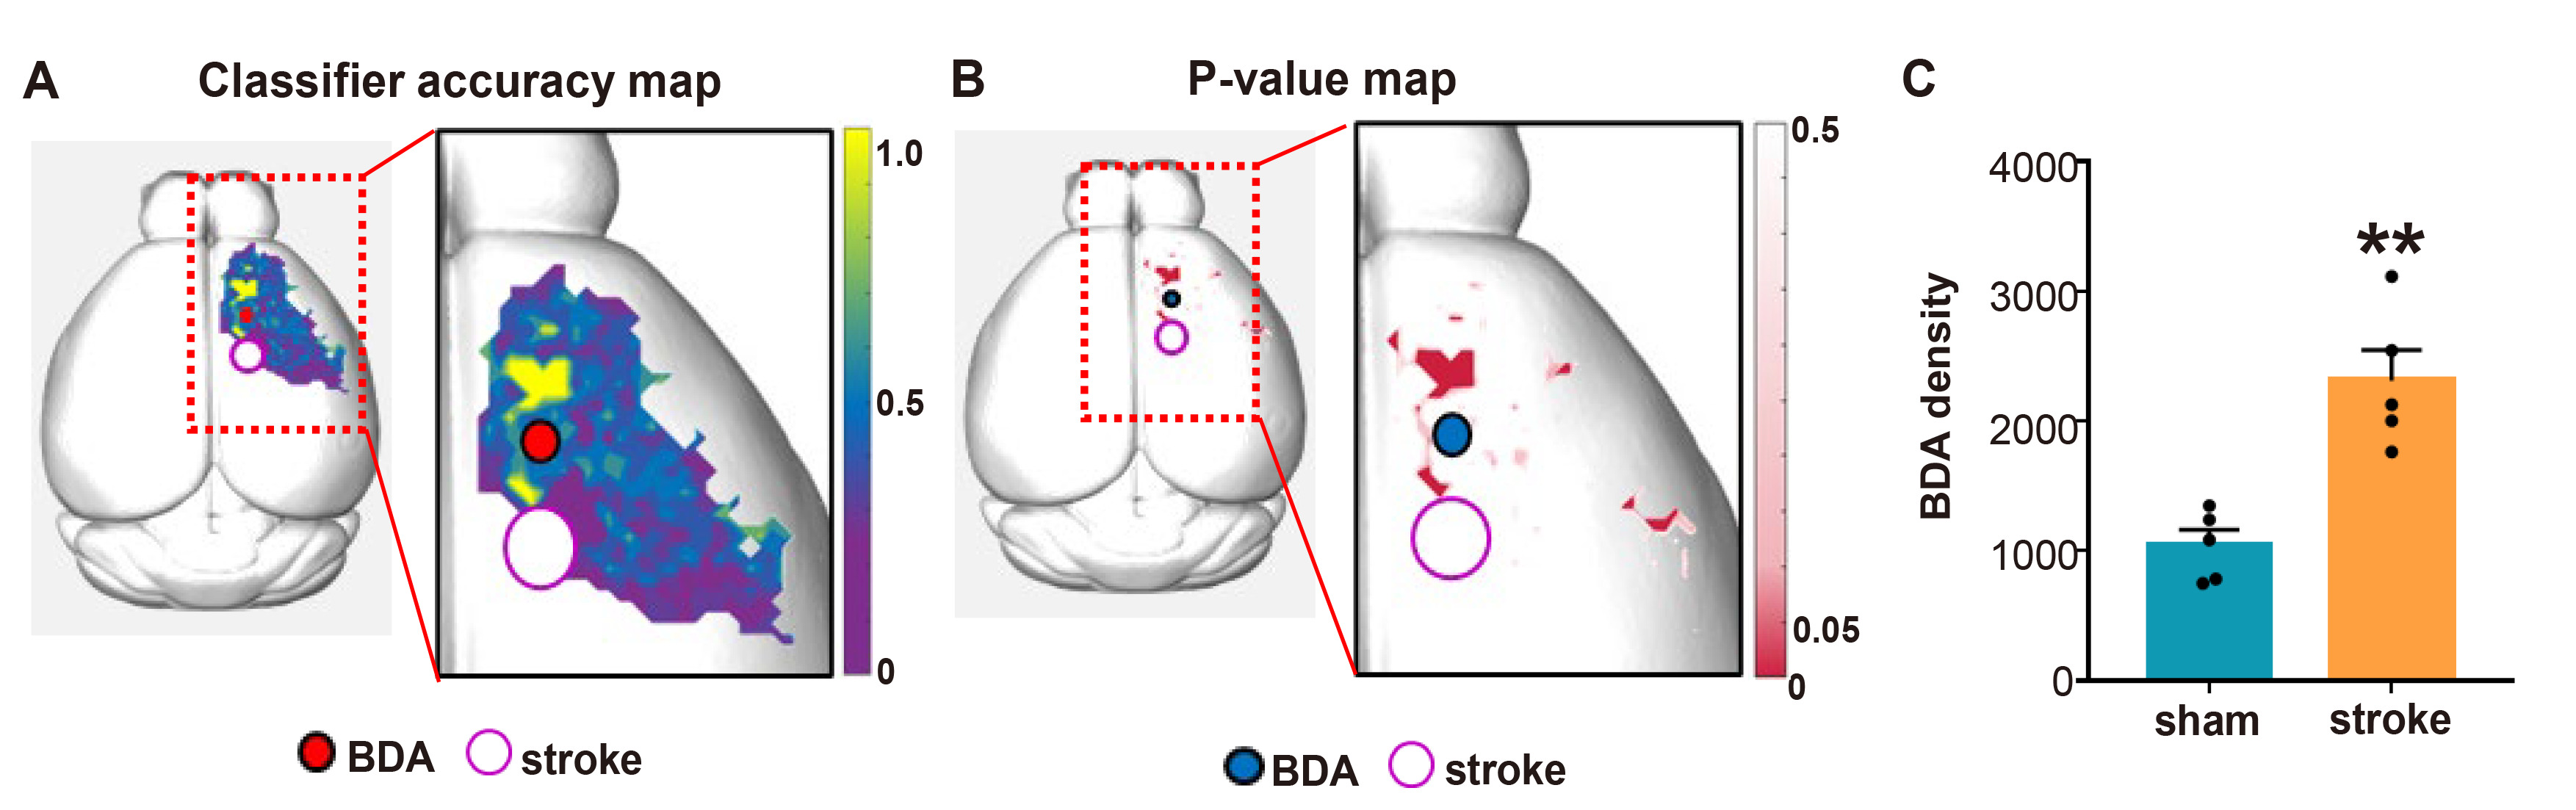
Fig. 6. Classifier accuracy-based axonal plasticity mapping and statistical analysis. (A, B) Accuracy map and p value map plotted on 3d brain images. Individual pixel’s p value was statistically analyzed by binomial test. p value map was plotted after Benjamini-Hochberg false discovery rate (FDR) correction. (C) BDA density of FDR<0.05 pixels following binomial tests, BDA density was extracted from FDR<0.05 pixels of each subject and analyzed by two-tailed unpaired t-tests. Stroke group showed significantly higher density of BDA compared to sham-operated group (p=0.0014, n=5). Data were plotted as mean±SEM. **p<0.01 for sham vs stroke group.
© Exp Neurobiol