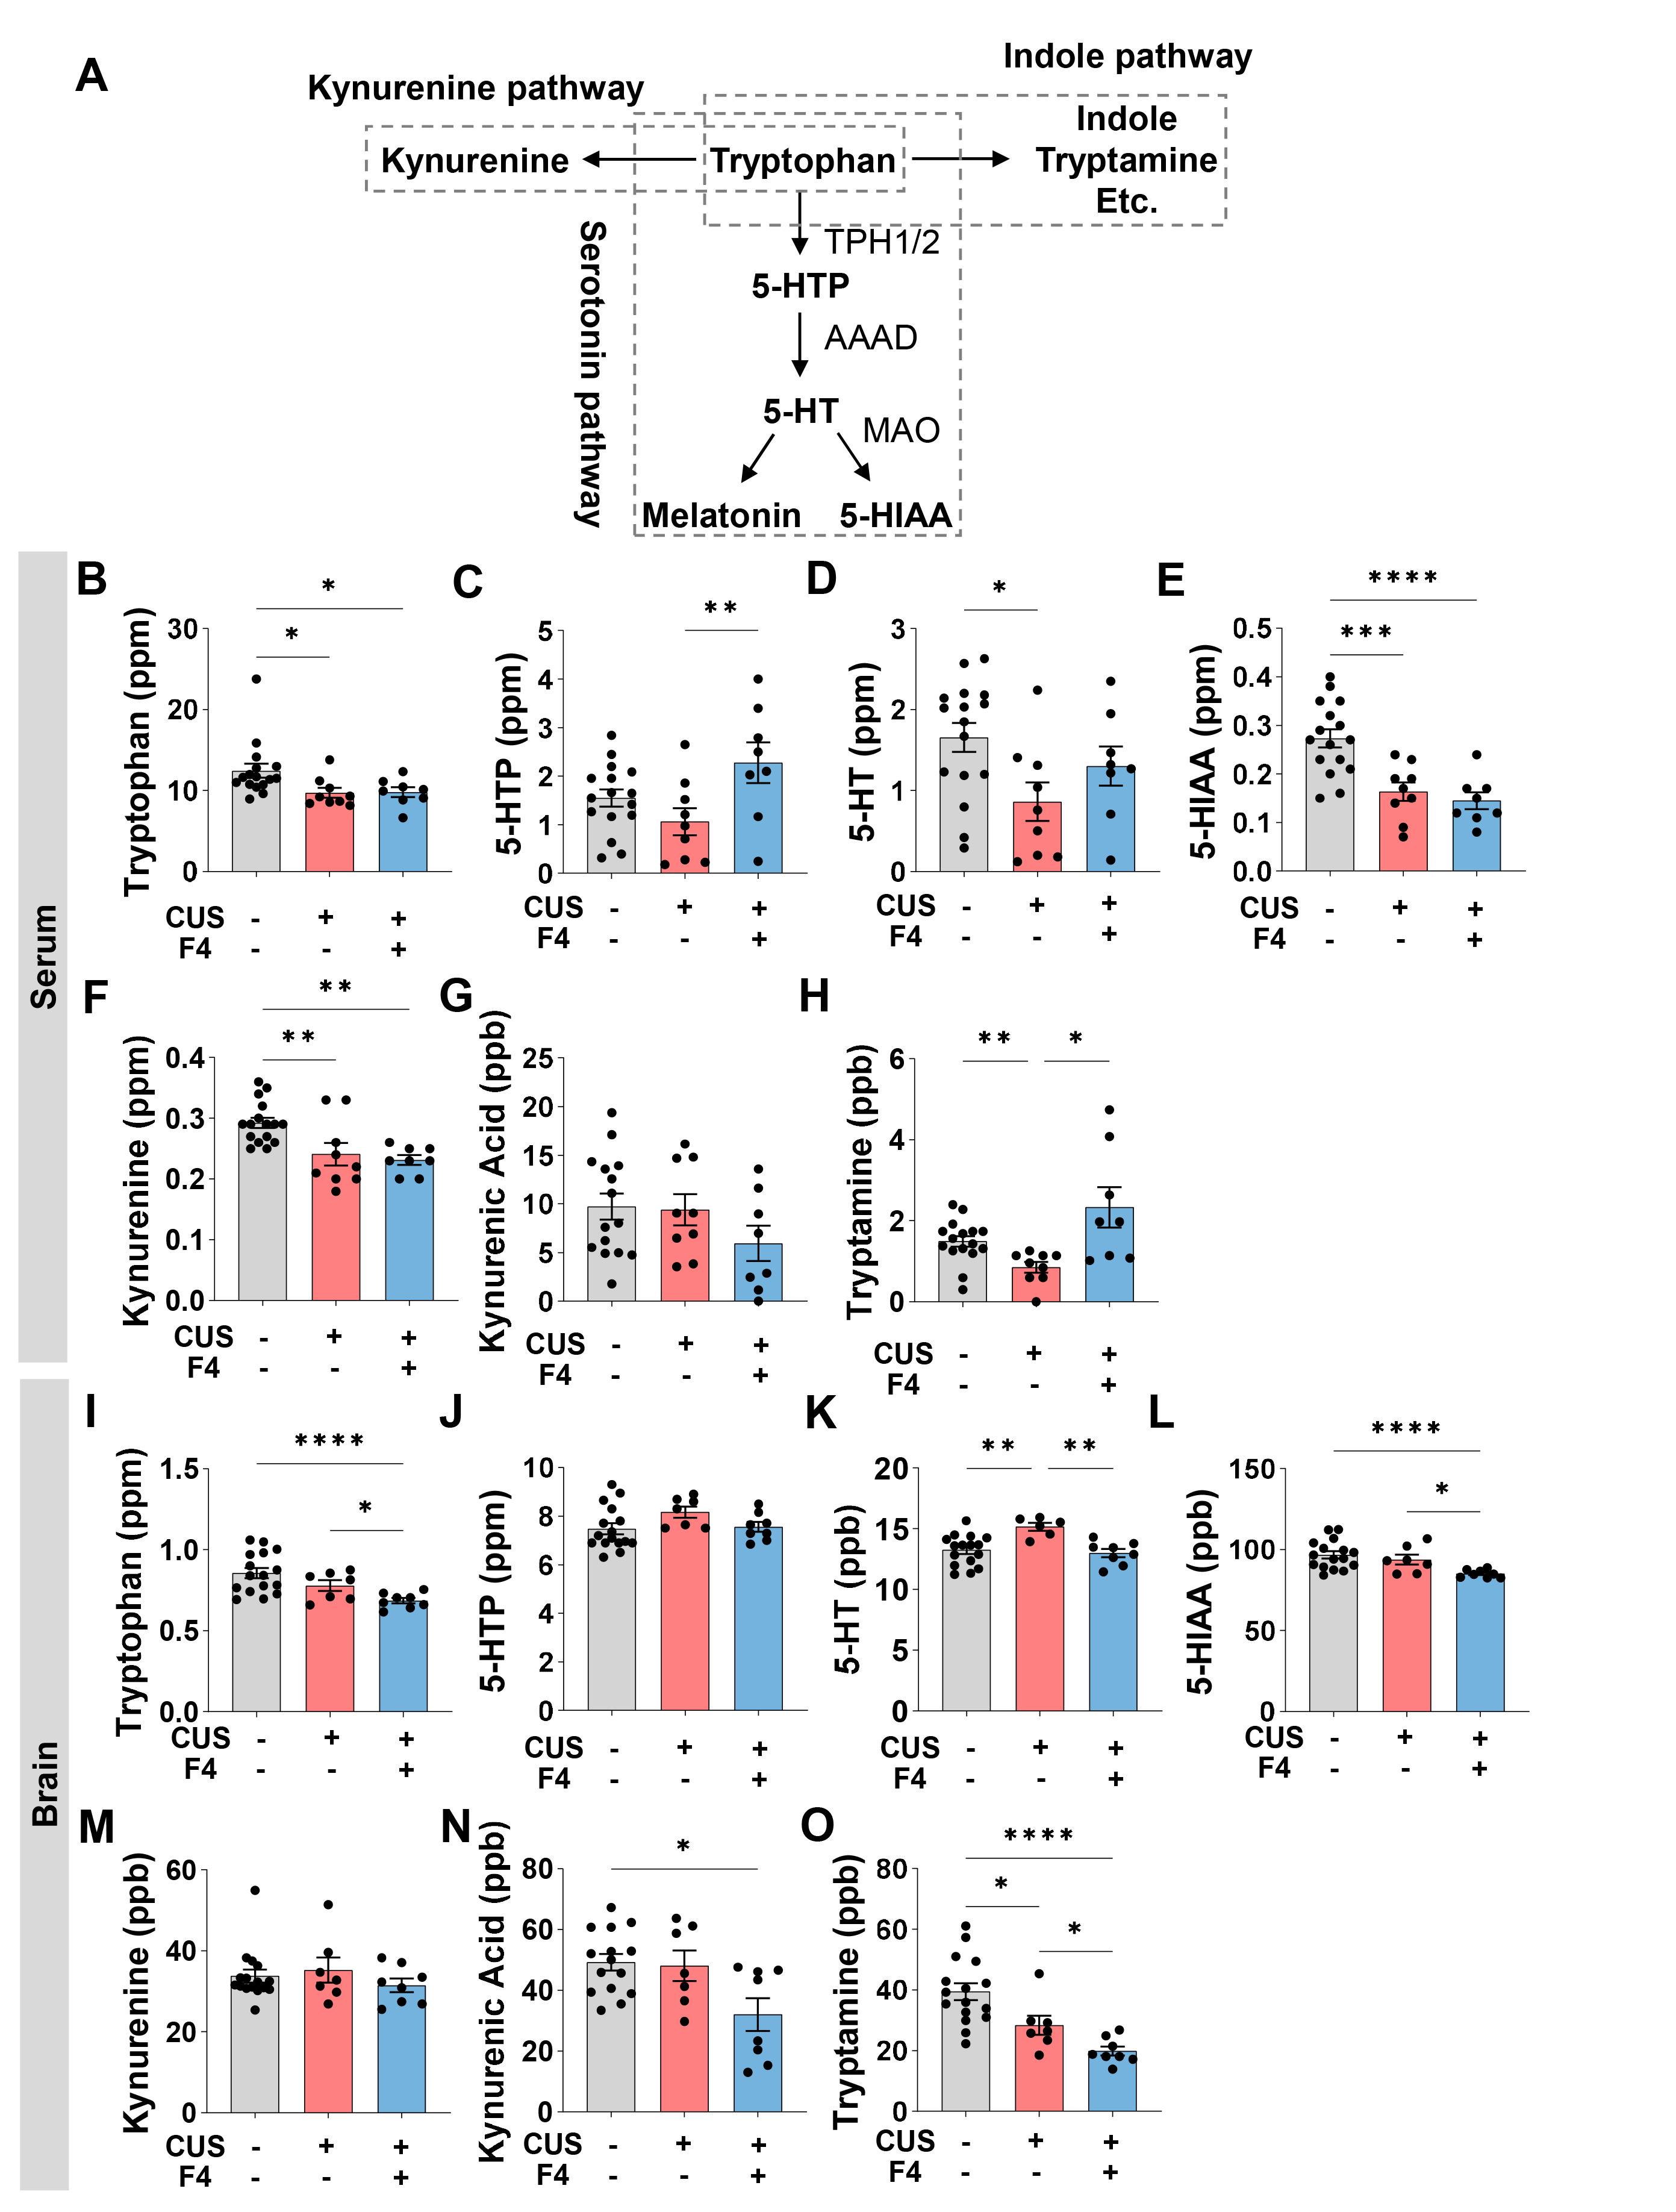
Fig. 2. CUS and F4 consumption changed 5-HT and tryptophan metabolic pathways in the serum and brain. (A) A simplified schematic diagram of tryptophan metabolic pathways. (B~H) Concentrations of tryptophan metabolites in serum. (B) Tryptophan. Unpaired Welch’s t-test; Control (n=16), CUS+Veh (n=9), CUS+F4 (n=8). (C) 5-HTP. Uncorrected Fisher’s LSD; Control (n=16), CUS+Veh (n=9), CUS+F4 (n=8). (D) 5-HT. Uncorrected Fisher’s LSD; Control (n=16), CUS+Veh (n=9), CUS+F4 (n=8). (E) 5-HIAA. Uncorrected Fisher’s LSD; Control (n=16), CUS+Veh (n=9), CUS+F4 (n=8). (F) Kynurenine. Uncorrected Fisher’s LSD; Control (n=16), CUS+Veh (n=9), CUS+F4 (n=8). (G) Kynurenic acid. Uncorrected Fisher’s LSD; Control (n=16), CUS+Veh (n=9), CUS+F4 (n=8). (H) Tryptamine. Unpaired Welch’s t-test; Control (n=16), CUS+Veh (n=9), CUS+F4 (n=8). (I~O) Concentrations of tryptophan metabolites in brain. (I) Tryptophan. Unpaired Welch’s t-test; Control (n=16), CUS+Veh (n=7), CUS+F4 (n=8). (J) 5-HTP. Uncorrected Fisher’s LSD; Control (n=16), CUS+Veh (n=7), CUS+F4 (n=8). (K) 5-HT. Uncorrected Fisher’s LSD; Control (n=16), CUS+Veh (n=7), CUS+F4 (n=8). (L) 5-HIAA. Unpaired Welch’s t-test; Control (n=16), CUS+Veh (n=7), CUS+F4 (n=8). (M) Kynurenine. Uncorrected Dunn’s test. Control (n=16), CUS+Veh (n=7), CUS+F4 (n=8). (N) Kynurenic acid. Uncorrected Dunn’s test; Control (n=16), CUS+Veh (n=7), CUS+F4 (n=8). (O) Tryptamine. Unpaired Welch’s t-test; Control (n=16), CUS+Veh (n=7), CUS+F4 (n=8); 5-HTP, 5-hydroxytryptophan; 5-HT, Serotonin; 5-HIAA, 5-Hydroxydindoleacetic acid. *p<0.05, **p<0.01, ***p<0.001, ****p<0.0001.
© Exp Neurobiol