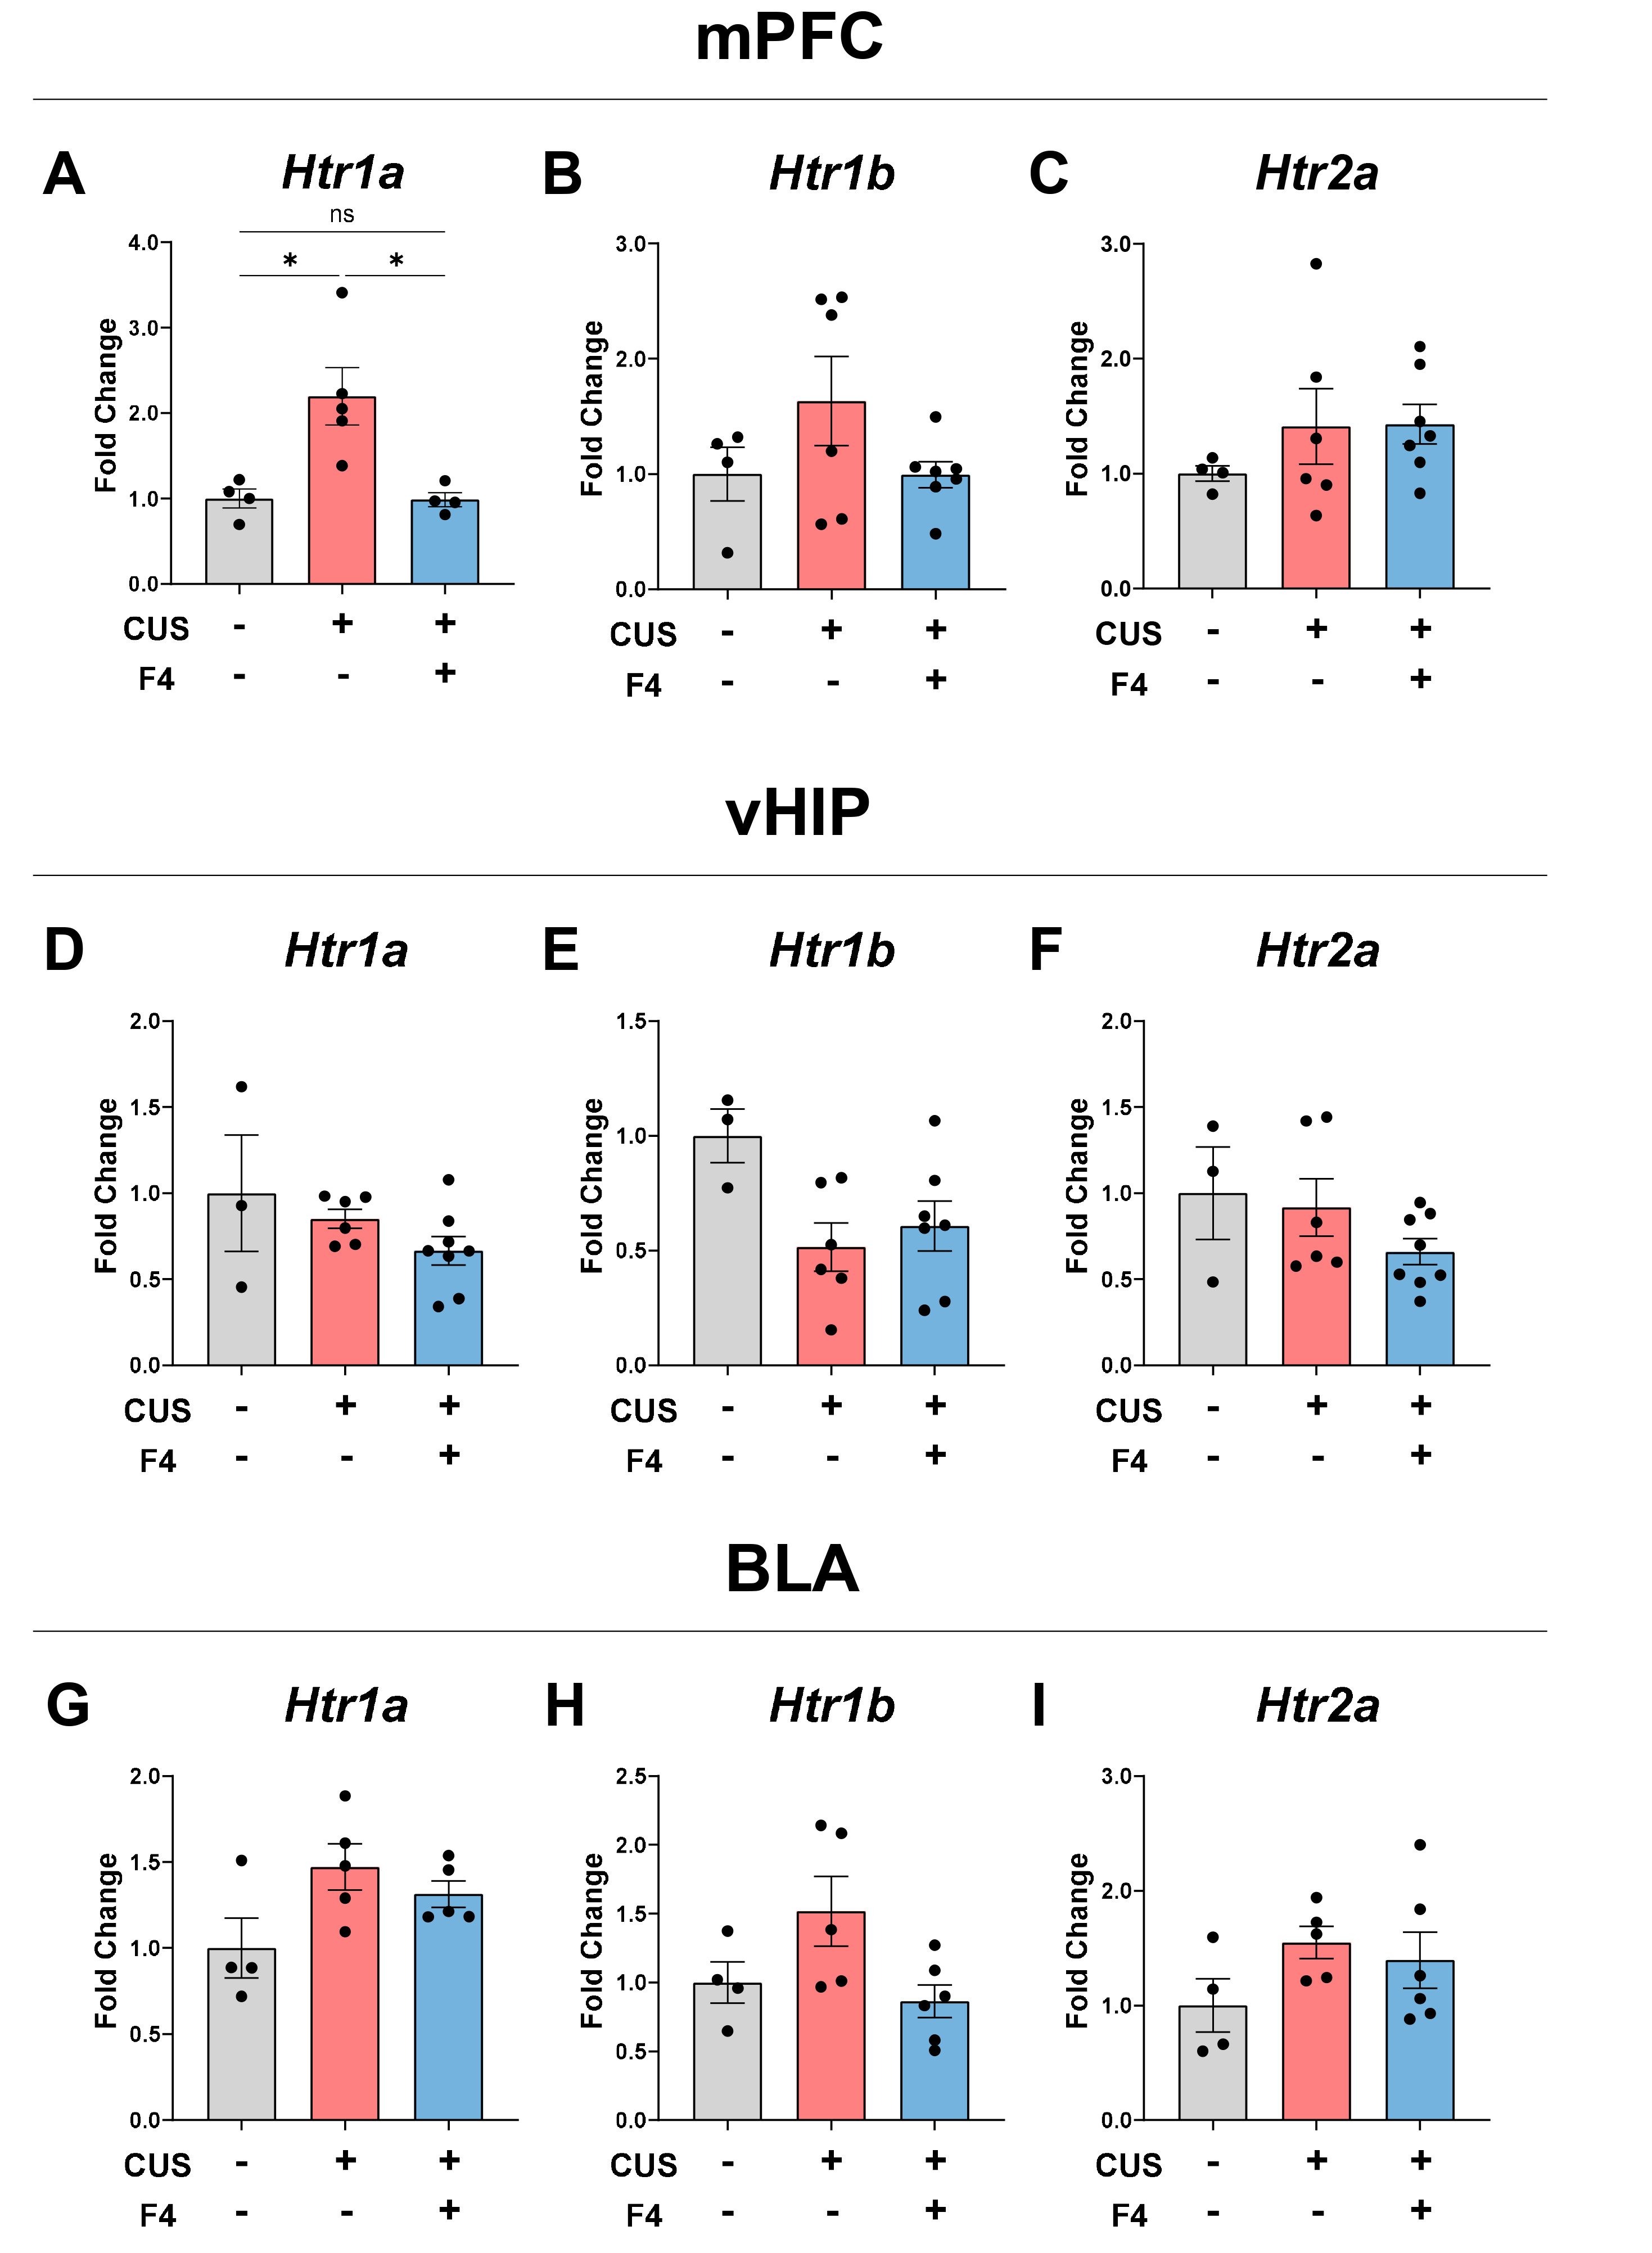
Fig. 3. CUS-induced upregulation of Htr1a in the mPFC was recovered by F4 treatment. (A~C) mRNA expression levels of 5-HT receptor types in the mPFC. (A) Htr1a. Tukey’s test; Control (n=4), CUS+Veh (n=5), CUS+F4 (n=4). (B) Htr1b. Tukey’s test; Control (n=4), CUS+Veh (n=5), CUS+F4 (n=7). (C) Htr2a. Tukey’s test; Control (n=4), CUS+Veh (n=5), CUS+F4 (n=7). (D~F) mRNA expression levels of 5-HT receptor types in the vHIP. (D) Htr1a. Tukey’s test; Control (n=3), CUS+Veh (n=6), CUS+F4 (n=8). (E) Htr1b. Tukey’s test; Control (n=3), CUS+Veh (n=6), CUS+F4 (n=8). (F) Htr2a. Dunn’s test; Control (n=3), CUS+Veh (n=6), CUS+F4 (n=8). (G~I) mRNA expression levels of 5-HT receptor types in the BLA. (G) Htr1a. Tukey’s test; Control (n=4), CUS+Veh (n=5), CUS+F4 (n=6). (H) Htr1b. Tukey’s test; Control (n=4), CUS+Veh (n=5), CUS+F4 (n=6). (I) Htr2a. Tukey’s test; Control (n=4), CUS+Veh (n=5), CUS+F4 (n=6). *p<0.05, ns (not significant). mPFC, medial prefrontal cortex; vHIP, ventral hippocampus; BLA, basolateral amygdala.
© Exp Neurobiol