Articles

Article Tools
 View Full Text View Full Text |
 Abstract Abstract |
 Article as PDF Article as PDF |
 Print this Article Print this Article |
 Pubmed Pubmed |
 PMC PMC |
 PubReader PubReader |
 Export to Citation Export to Citation |
 Email Alerts Email Alerts |
 Open Access Open Access |
Share this article on :


Stats or Metrics
Article
Original Article
Exp Neurobiol 2019; 28(3): 376-389
Published online June 26, 2019
https://doi.org/10.5607/en.2019.28.3.376
© The Korean Society for Brain and Neural Sciences
Metabolomic Analysis Identifies Alterations of Amino Acid Metabolome Signatures in the Postmortem Brain of Alzheimer's Disease
Yoon Hwan Kim1,2, Hyun Soo Shim3, Kyoung Heon Kim2, Junghee Lee4,5, Bong Chul Chung1, Neil W. Kowall4,5, Hoon Ryu3,4,5,6*, and Jeongae Lee1,6*
1MolecularRecognition Research Center, Korea Institute of Science and Technology, Seoul 02792, Korea.
2Department of Biotechnology, Graduate School, Korea University, Seoul 02792, Korea.
3Center for Neuroscience, Brain Science Institute, Korea Institute of Science and Technology, Seoul 02792, Korea.
4Veteran's Affairs Boston Healthcare System, Boston, MA 02130, USA.
5Boston University Alzheimer's Disease Center and Department of Neurology, Boston University School of Medicine, Boston, MA 02118, USA.
6Convergence Research Center for Diagnosis, Treatment and Care System of Dementia, Korea Institute of Science and Technology, Seoul 02792, Korea.
Correspondence to: *To whom correspondence should be addressed.
Jeongae Lee, TEL: 82-2-958-6632, FAX: 82-2-958-5059
e-mail: frans@kist.re.kr
Hoon Ryu, TEL: 1-857-364-5910, FAX: 1-857-364-4540
e-mail: hoonryu@bu.edu
Abstract
Despite significant advances in neuroscience research over the past several decades, the exact cause of AD has not yet fully understood. The metabolic hypothesis as well as the amyloid and tau hypotheses have been proposed to be associated with AD pathogenesis. In order to identify metabolome signatures from the postmortem brains of sporadic AD patients and control subjects, we performed ultra performance liquid chromatography coupled with linear ion trap-Orbitrap mass spectrometer (UPLC-LTQ–Orbitrap-MS). Not only our study identified new metabolome signatures but also verified previously known metabolome profiles in the brain. Statistical modeling of the analytical data and validation of the structural assignments discovered metabolic biomarkers associated with the AD pathogenesis. Interestingly, hypotaurin, myo-inositol and oxo-proline levels were markedly elevated in AD while lutamate and N-acetyl-aspartate were decreased in the postmortem brain tissue of AD patients. In addition, neurosteroid level such as cortisol was significantly increased in AD. Together, our data indicate that impaired amino acid metabolism is associated with AD pathogenesis and the altered amino acid signatures can be useful diagnostic biomarkers of AD. Thus, modulation of amino acid metabolism may be a possible therapeutic approach to treat AD.
Graphical Abstract
Keywords: Alzheimer's disease, Metabolomics, Liquid chromatography mass spectrometry, Biomarkers, amino acid metabolism
INTRODUCTION
It becomes a major public health issue that, as the elderly population grows, the number of AD patients has been correlatively and rapidly increased over the world for last several decades [1,2]. AD is known as a typical neurodegenerative disorder of dementia and is characterized by progressive cognitive decline and memory loss [1,2,3]. There are several plausible causes of AD pathology including deposition of β-amyloid plaques (Aβ), hyperphosphorylation of tau protein, inflammation, abnormal metal homeostasis, mitochondrial dysfunction, disruption in energetic and neurotransmitter pathways, oxidative stress and genetic mutations [1,4,5,6,7,8]. However, the exact etiology of AD has not been fully identified yet except familial cases. AD is diagnosed by examinations of psychiatric history, family history, physical and neurological symptoms [1,9]. The sensitivity and specificity of clinical diagnosis methods are quite low and only effective in patients with significant cognitive decline. Moreover, there is no single and simple test for AD diagnosis.
Currently, the pathological examination of postmortem brain is widely accepted as the final diagnostic method of AD by confirming senile plaques and fibrous Tau tangles using a staining method such as Gallyas-Braak (GB) after the patient's death [10]. The identification of highly sensitive biomarkers for diagnosing AD at the early stage is critical for the development of therapeutic drug or strategy to treat AD. As we have learned from previous studies that therapeutic approaches for clearing Aβ has a 99.6% failure rate, now it is a common sense not only novel effective drug targets need to be discovered but also treatments may have to be initiated before the onset of the AD. In this context, metabolomics technology can be a useful tool to detect altered metabolites that are closely associated with AD pathogenesis. Metabolomics is one of the ‘omics’ technologies that can analyze the repertoire of small molecules (<1500 Da) present in cells, tissue, urine, blood, plasma, serum and other specimens [11,12]. Indeed, metabolomics approach has been used to explore metabolic changes and to monitor disease progression of AD [13,14,15,16,17]. In general, the postmortem brain tissue represents a “Gold Standard” to diagnose the pathological conditions of AD. The postmortem brain-based metabolomics is advantageous over other samples such as urine, plasma, and serum because it can identify
In this study we aimed to investigate what metabolome signatures are affected in the cortex of postmortem brain tissues from AD patients and control subjects by ultra high performance liquid chromatography coupled with linear ion trap-Orbitrap mass spectrometer (UPLC-LTQ–Orbitrap-MS). We further conducted multivariate analysis approaches to determine changes of metabolite levels in the brain tissue and to identify potential/possible biomarkers for the diagnosis and treatment of AD.
MATERIALS AND METHODS
All chemicals, reagents and solvents were analytical reagent grade unless otherwise stated. Deionized water for aqueous solutions was prepared by Milli-Q purification system (Millipore, Bedford, MA, USA). HPLC-grade acetonitrile (ACN) and ethanol were purchased from Burdick & Jackson (Muskegon, MI, USA). Formic acid, ammonium acetate and phosphate-buffered saline (PBS) were purchased from Sigma-Aldrich (St. Louis, MO, USA). Homogenization of brain sample was conducted by TissueLyser from Qiagen (West Sussex, UK).
Neuropathological processing of control and AD postmortem brain samples was performed as previously established by the Boston University Alzheimer's Disease Center (BUADC) [20]. The postmortem brain tissues were selected based on the Braak stage score, a gold standard pathological criteria. Severe AD group was selected from above 5 Braak stage score. The superior temporal cortex (mainly gray matter) was obtained from frozen brain samples. All brains were donated with consent of the next of kin after death. Institutional review board approval was obtained through the BUADC. The study was performed in accordance with institutional regulatory guidelines and principles of human subject protection in the Declaration of Helsinki. Detailed information of the brain tissues is described in Supplementary Table 1.
One hundred milligram of frozen postmortem brain tissue (the superior temporal cortex mainly containing the gray matter) samples were precisely weighed, and 500 µl of degassed extraction solvent (ethanol/10 mM phosphate buffer saline; 85:15, v/v) were added into 2 mL Safe-Lock tube (Eppendorf, Germany) containing ceramic beads. Degassed extraction solvent was used to avoid oxidizing oxidize thiols or antioxidants [27]. The samples were homogenized using a TissueLyser at 25 Hz for 5 min. Homogenates were centrifuged at 12,000g, 4℃ for 10 min, subsequently, a 100 µl of the supernatant was transferred into another test tube and evaporate to dryness under gentle nitrogen stream. The residue was reconstituted with 100 µl of 0.1% formic acid in 5% ACN solution. After reconstitution, the 5 µl (RPC separation mode)/3 µl (HILIC separation mode) of samples were analyzed by UPLC-LTQ–Orbitrap MS. The whole schematic view of human postmortem brain tissue sample preparation step is described in Suppl. Fig 1. In order to validate system stability and repeatability, a pooled quality control (QC) sample was prepared by mixing equal amounts of samples. To ensure system stability, 10 QC samples were injected prior to analysis and solvent blank and QC sample was injected every 9 sample injections for verifying system reproducibility during sample sequence.
Metabolite profiling was performed on Ultimate 3000 UHPLC system from Thermo Fisher Scientific (San Jose, CA, USA) coupled with an LTQ-OrbitrapVelos Pro hybrid mass spectrometer from Thermo Fisher Scientific equipped with an electrospray source operating at either positive (ESI+) or negative ionization mode (ESI−). MS operation parameters were as follows: spray voltage, 3.5~5 kV; sheath gas, 5~45 (arbitrary units); auxiliary gas, 1 (arbitrary units); sweep gas, 1 (arbitrary units); and capillary temperature, 320℃. Each sample was analyzed in FTMS full scan mode at a resolving power of 100,000 and the m/z ranges were set to 50~1200 in centroid mode. The system was controlled by Xcalibur software v2.2, Tune Plus 2.7, and Chromeleon MS Link software v6.80 from Thermo Fisher Scientific. The data analysis was achieved using Xcalibur software v2.2 and SIEVE software v2.1 from Thermo Fisher Scientific.
Reversed-phase separation was performed on an Acquity™ UPLC BEH C18 column (2.1 mm×100 mm, 1.7 µm, Waters, Milford, MA, USA) UPLC analytical column. The mobile phase solvents were 95% water, 5% ACN and 0.1% formic acid (mobile phase A) and 95% ACN, 5% water and 0.1% formic acid (mobile phase B). The elution gradient was as follows: 100% mobile phase A from 0 to 3 min; linear increase to 50% mobile phase B from 3 to 10 min; linear increase of mobile phase B from 50% to 90% 10 to 12 min; maintain of mobile phase B for 90% 12 to 12.5min; reequilibration with 100% mobile phase A from 12.5 to 14 min. The column was maintained at 40℃; total run time was 14 min. A 5 µl aliquot of each sample was injected for analysis. The samples were kept at 4℃ in an autosampler during the analysis.
HILIC separation was performed on an Acquity™ UPLC BEH HILIC C18 column (2.1 mm×100 mm, 1.7 µm, Waters, Milford, MA, USA) UPLC analytical column. The mobile phase solvents were 5% water, 95% ACN and 10mM ammonium acetate (mobile phase A) and 50% ACN, 50% water and 10mM ammonium acetate (mobile phase B). The elution gradient was as follows: 100% mobile phase A from 0 to 2 min; linear increase to 30% mobile phase B from 2 to 8 min; linear increase of mobile phase B from 30% to 50% 8 to 12 min; re-equilibration with 100% mobile phase A from 13 to 22 min. The column was maintained at 40℃; total run time was 22 min. A 3 µl aliquot of each sample was injected for analysis. The samples were kept at 4℃ in an autosampler during the entire analysis. A pooled quality control (QC) sample which made by mixing equal amounts of samples and blank solvent used for checking system stability and sample carryover.
The data processing procedure was as follows. The raw data were analyzed by Thermo Scientific SIEVE software v2.1 with “Small molecule”, “Chromatographic Alignment and Framing”, and “Non-differential single class analysis” options. All data was scaled by the Pareto (Par) scaling method before analysis [21].
Multivariate analysis (MVA) was performed using SIMCA-P software v14.0+ from Umetrics (Umeå, Sweden) for the principal component analysis (PCA) and orthogonal projection to latent structures-discriminant analysis (OPLS-DA). Pathway impact analysis and heatmap visualization were performed by Metaboanalyst 3.0 (Montréal, QC, Canada), a web-based metabolomics data processing tool and visualization metabolomics. The pathway mapping and chemical similarity analysis were generated by R version 3.2.2, MetaMapp and CytoScape 3.4.0 (Boston, MA, USA) [22,23]. SPSS 22.0 (SPSS Inc., Chicago, IL, USA) and Origin were used for statistical analysis and fitting.
Statistical analysis such as multivariate analysis was conducted to identify metabolites that showed differences between AD group and control group. The variable importance in projection (VIP) value>1 was considered as significant metabolites. Statistical significance was analyzed with SPSS 22.0 (SPSS Inc., Chicago, IL, USA). Mann-Whitney U-test was performed for determining two-group comparison. Differences with p-value<0.05 were considered statistically significant. Fold change was measured using the variation of the measured value.
After finding potential discriminative ion by VIP value and p-value, the characteristic masses were submitted to the web server MassTRIX (Mass TRanslator into Pathways) using
RESULTS
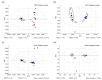
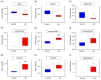
In order to discover disease-specific metabolites and to identify biomarkers of AD, we conducted an untargeted metabolite profiling workflow in this study (Suppl. Fig. 2).The QC samples were analyzed to evaluate analytical drift after the performance of pre-acquisition normalization. The RSD of the metabolite ions in all QC samples was less than 30%, indicating that the reproducibility of the analytical performance was sufficient for further metabolomics study [27,28]. Also, all samples were evaluated by principal component analysis (PCA) score plot to visualize more specific data about analytical performance stability. A total of 13 QC samples were analyzed during the entire analysis. The result showed that QC samples were tightly clustered on all separation mode except for RPC-negative mode (Fig. 1) [29]. To investigate whether the variation in the metabolic profile is altered in the post mortem brain of AD patients, all obtained data from four different methods were analyzed using PCA plots. As we expected, both RPC-positive and negative mode showed apparently separated clusters of metabolites between AD patients and control subjects. But HILIC separation mode did not show clustering between AD patients and control subjects (Fig. 2). Subsequently, an additional discriminant analysis, orthogonal projection to latent structure-discriminant analysis (OPLS-DA) modeling, was conducted for getting more information [30,31].
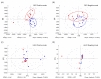
MVA was performed to obtain a list of variables from the variation of the metabolic profiles in the postmortem brain of AD patients and control subjects. All variables from four different analytical methods were separately analyzed using OPLS-DA model [30]. OPLS-DA model was applied to identify possible biomarker metabolites which can be used to distinguish AD from control groups. The supervised OPLS-DA model is shown in Fig. 3. The results showed clearly separated categories for all models. An explained variance (R2Y) and predictability (Q2Y) was as follow; RPC positive mode: 0.927, 0.752, RPC negative mode: 0.987, 0.752, HILIC positive mode: 0.762, 0.119 and HILIC negative mode: 0.613, 0.119. The variable ions with higher VIP values had a greater impact on differential categorization in the model. The variable ions to be used for metabolic screening have been determined based on VIP value larger than 1 and p-value less than 0.05. A total 89 variables met this criteria (RPC positive mode: 59, RPC negative mode: 11, HILIC positive mode: 11 and HILIC negative mode: 2). Detailed information is shown in Suppl. Table 2.
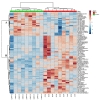
Of the 86 variable ions which met screening criteria (VIP> 1 and p value <0.05), 62 variable ions were identified by the web server MassTRIX (Supple. Table 2) [24]. In order to better illustrate the difference in metabolite concentrations between AD and control, semi-identified metabolites were used for clustering and heatmap analysis as shown in Fig. 4. The metabolic clustering distribution can be divided into are A and area B. Metabolites in area A were significantly reduced in AD (n=25).On the contrary, most of the metabolites of area B were increased in AD (n=64).
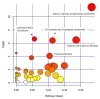
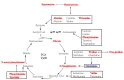
MVA of the functional metabolite profile by OPLS-DA further verified that the metabolite concentration was changed in the post mortem brain of AD. To better understand how metabolome changes in the postmortem brain of AD were interrelated, we implemented the metabolic pathway analysis. The pathway impact analysis was based on KEGG database and MetaboAnalyst 3.0 for comprehensive metabolic data analysis, visualization, and interpretation [24,32]. Altered metabolic pathways in the post mortem brain of AD were visualized in Fig. 5. The x-axis represents the pathway topology analysis and the y-axis represents the pathway enrichment analysis. The results of the pathway impact analysis are shown in Table 1. The pathway analysis identified that metabolic deregulations in AD pathogenesis were significantly associated alanine, aspartate and glutamate metabolism, D-glutamine and D-glutamate metabolism, purine metabolism, and arginine and proline metabolism. Additionally, metabolic up/down regulation in the postmortem brain of AD was marked on
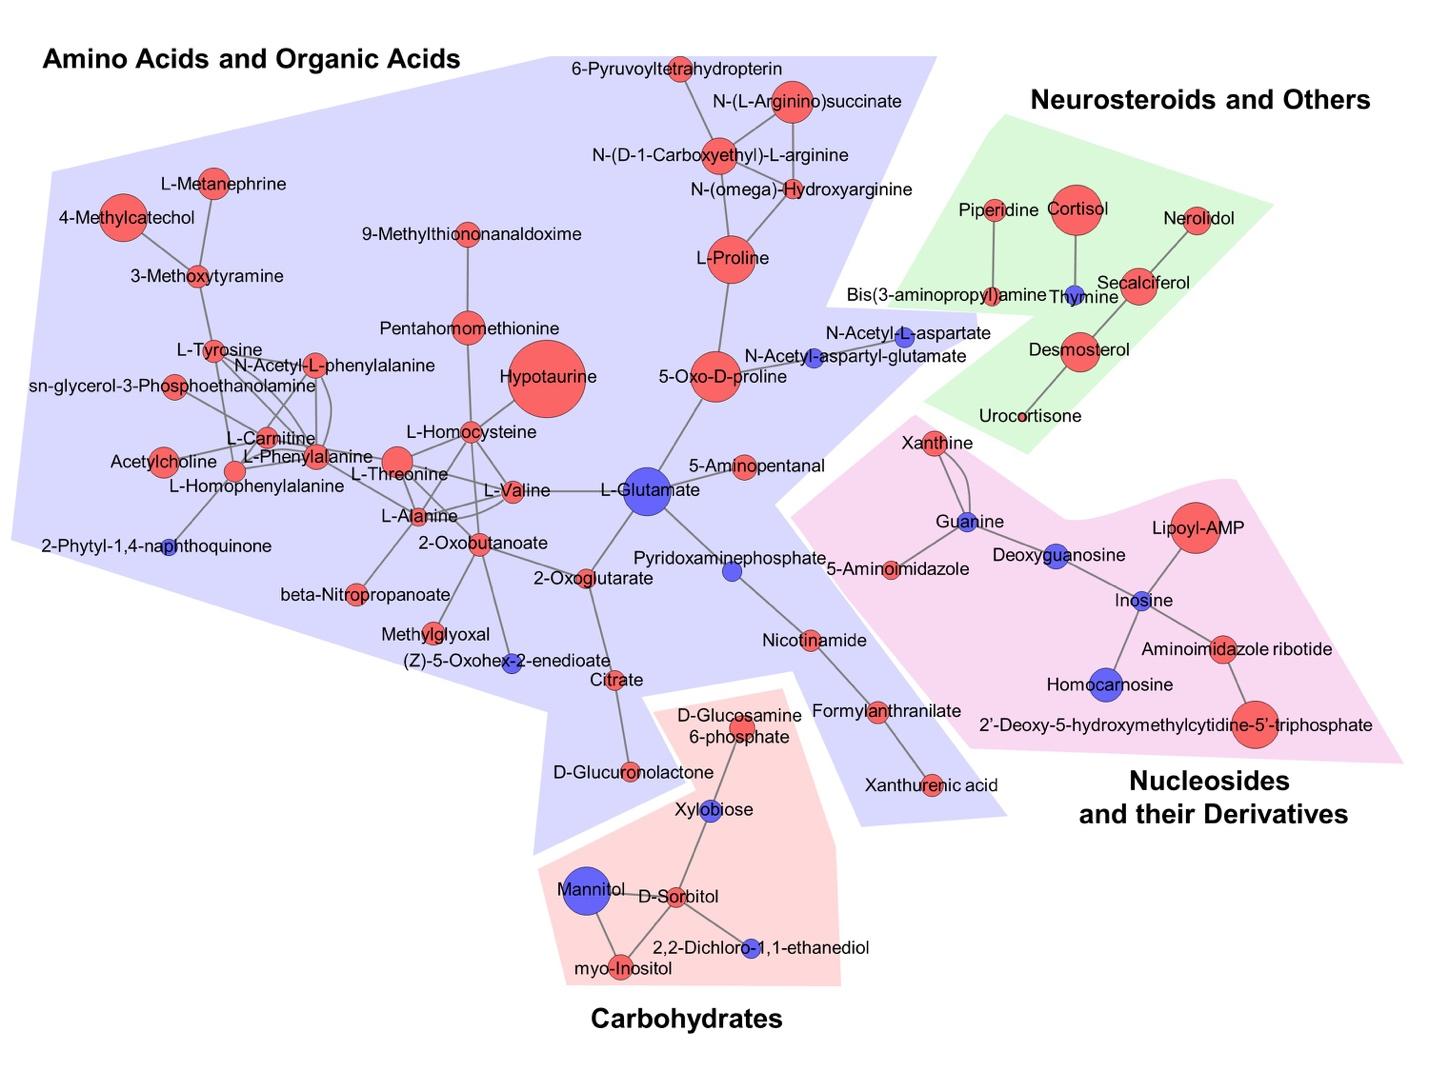
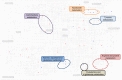
Mass spectrometer-based non-target metabolomic analysis often includes new metabolites that have not been reported for the enzyme reaction yet. Accordingly, network analysis which relies on current biochemical databases does not properly visualize the relationship between new metabolites that are not structurally identified. In order to overcome this problem, the biochemical similarity between AD-associated metabolites was analyzed and visualized using MetaMapp and Cytoscape [22,23] (Fig. 7). MetaMapp exhibited the correlation between the AD-associated metabolites based on their chemical structure and functional groups classified by the PubChem [33]. Importantly, there were metabolite signatures which met appropriate VIP, p-value, and fold-change criteria such as hypotaurine, lipo-AMP, myo-inositol, citrate, and neurosteroids.
DISCUSSION
In the current study, we performed untargeted metabolite profiling approach to specifically explorer the metabolic signatures in human postmortem brain tissues that is associated with AD. To gather the deeper insight of view about the AD pathogenesis in the brain, two (2) different ionization mode and chromatographic method were applied (ESI+, ESI−, RPC and HILIC). Meaningful metabolite profile fluctuations were identified by MVA and semi-identified by its m/z values and retention time. As a result, we identified metabolome profiles that are significantly altered in the frontal cortex of AD patients compared to control subjects. The metabolomic signatures have similarities or differences in comparison to the metabolomic profiles in previously reported studies [34,35,36,37,38,39,40,41,42,43].
For the first time, we discovered new metabolome profiles that were not previously known in the brain of AD while some of metabolome profiles were consistent with the observation by other researchers. Notably, out study identified that hypotaurine is very significantly increased in the brain of AD patients. The elevation of hypotaurine in AD has not been reported and clarified in the previous studies yet. Hypotaurine is known an immediate precursor of taurine. In astrocytes, hypotaurine and taurine act as partial agonist of GABA-A receptors [44]. The previous study discovered that hypotaurine-induced responses are mediated by glycine receptor activation in the substantia gelatinosa (SG) neurons [45]. Hypotaurine is enzymatically oxidized to yield taurine by hypotaurine dehydrogenase. Taurine can cross the blood brain barrier (BBB) and involves in a wide array of physiological phenomena including inhibitory neurotransmission, long-term potentiation in the striatum/hippocampus, and possible protection against glutamate excitotoxicity and prevention of epileptic seizures [46,47,48,49]. Interestingly, recent studies on glioma have shown that hypotaurine interferes with hypoxia signaling, leading to malignant phenotypes [50,51]. Hypotaurine acts as a competitive inhibitor to activate signals in prolyl hydroxylase domain-2 (PHD2), which regulates hypoxia signals. PHD2 activates the signal by converting proline and 2-oxoglutarate to 4-hydroxyproline and succinate [51]. In fact, we checked our metabolomic profiles and confirmed that succinate and 4-hydroxyproline were not detected, but a significant increase in 2-oxoglutarate was observed in the brain of AD patients.
On the other hand, our finding on the variation of NAA, NAAG, glutamate, myo-inositol, cortisol, and amino acid metabolism in AD was consistent with the observation from previous studies. NAA is a biomarker of neuronal health, axonal viability and density [34]. The decrease in NAA and NAAG concentration in the brain of AD patients is correlated with the presence of nerve fiber entanglement [35]. In general, human and animal postmortem brain tissue homogenates include both pre- and post-synaptic structures, indicating that the quantity of metabolites including glutamate is determined from the most of intact intracellular compartments [52,53]. At the moment, due to a limitation of methodology when we process the frozen human postmortem brain, it is quite difficult to distinguish the exact localization site of metabolites (for example, in pre-synapse versus post-synapse). In this context, development of a novel and advanced quantification technology may facilitate the precise quantitation of brain tissue metabolites in various cellular compartments and cell types. In the current study, we analyzed the temporal cortex (gray matter) of postmortem brain and found the significant reduction of NAA, whereas other groups have previously shown no change or slight increase of NAA in the frontal cortex of AD postmortem brain [54,55]. Otherwise, global metabolomics through the brain region mapping combined with LC-MS showed that the NAA level is elevated in the brain stem of animal model of inflammation [56]. We may propose two possible reasons of the inconsistent NAA level between other studies and our study. First, the different brain region may possess a different level of metabolite. Secondly, the species difference between human and rodents can be a critical factor for determining the variability of metabolite levels and signatures. Additionally, considering that drug treatments such as NMDA receptor antagonists or acetylcholinesterase inhibitors might affect the metabolome changes in the postmortem brains, lack of detailed medication history in AD patients and control subjects is possible limitations to interpret metabolome data in the current study.
NAA is a well-known reservoir of glutamate in neuronal tissues and it replenishes glutamate in response to dynamic neuronal signaling and stresses [36]. We found that NAA and NAAG levels were significantly decreased in the postmortem brain of AD. In contrast, we observed that myo-inositol is significantly increased in AD. Myo-inositol is a marker of gliosis or microglial activation. Therefore, increased myo-inositol concentration indicates the activation of glial cell proliferation or microglial activation. Notably, microglial activation is known to be associated with formation of amyloid plaques in a transgenic mouse TgCRND8 model (expressing a mutant form of the amyloid precursor protein 695 with both the Swedish and Indiana mutations and developing extracellular amyloid beta-oligomer deposits as early as 2~3 months) [43]. Otherwise, network analysis (pathway mapping) indicated that specific metabolites related to hypotaurine and amino acid catabolism are significantly increased in the brain of AD patients compared to control subjects. Not only there was fluctuation of various amino acid levels such as alanine, proline, valine, tyrosine, threonine, citrate and alpha-glutarate, but also chemical similarity analysis revealed significant changes in metabolite signatures related to the amino acid metabolism and TCA cycle in the brain of AD patients (Fig. 9).
Amino acids are essential substrates in the body and they play an important role as regulators in many metabolic pathways [57]. In this context, dysregulation of amino acid metabolism could be a one of pathological markers of AD. Indeed, the fluctuation of glutamate and alanine and tyrosine are observed in AD brain tissues. We observed that glutamate level was significantly decreased in AD as similar to NAA. Glutamate is the most abundant amino acid in the brain and acts as an excitatory neurotransmitter in the central nervous system of mammals. Glutamate plays an important physiological role in processes such as brain development, learning, memory, sensory activity, and synaptic transmission. Accordingly, the reduced level of glutamate can be regarded as a pathological brain biomarker in AD [37,38,39,40,41,42]. During amino acid catabolism, nitrogen wastes such as ammonia are formed, which can adversely affect neuronal cells in the brain. In general, to produce energy in healthy cells, the carbon skeleton is used in the TCA cycle to produce carbon dioxide, and excess nitrogen is treated as a non-toxic element rather than ammonia. However, in case of stress conditions such as AD, when neurons cannot efficiently break down glucose and gain energy, they become dependent on amino acid catabolism for energy production. Depletion of amino acids in the cells or dysfunctions of metabolic pathway may trigger neuronal cell damage and death according to the progression of AD. Otherwise, ammonia released during continuous amino acid metabolism can directly cause the damage of neuronal cells. To prevent this event, astrocytes play a role to protect neuronal cells from ammonia by overexpressing glutamine synthetase [58]. In the present study, we observed an apparent disturbance of TCA cycle metabolism in the AD brain. Our data exhibited a marked decrease in glutamate level and an increase in 2-oxoglutarate level, which could be evidence of abnormal amino acid catabolism. Despite our study was derived from severe sporadic AD cases, a clear distinction of amino acid metabolism between AD and control subjects were appeared and coincided with the previous studies. Because we collected severe cases of AD based on the Braak stage criteria, it was indispensable to have the age variation among the subjects. Indeed, when we compared the average age of subjects, the difference of age was marginal between control (Average±SEM: 81.56±4.09) and AD subjects (Average±SEM: 80.67±4.07). However, considering a fact that age and sex are important parameters influencing the metabolome signatures in serum and urine, the age difference of subjects should be considered for the future metabolomics studies using the postmortem brain [59,60].
In summary, we performed metabolomic approach combined with the high ranked pathway analysis and found that deregulation of amino acid metabolism pathway is closely linked to the pathogenesis of AD. Accordingly, variations of brain amino acid metabolites could be useful diagnostic markers of AD. Moreover, modulation of amino acid metabolism may be a plausible therapeutic approach to AD.
SUPPLEMENTARY MATERIALS
Supplementary Table 1
Supple Table 2
Molecules of interest as identified by VIP value and p-value for their significance to the model.
en-28-376-s002.pdfSupple Fig. 1
A scheme of human postmortem brain tissue sample processing for metabolic profiling.
en-28-376-s003.pdfSupple Fig. 2
A work-flow of metabolic profiling for the postmortem brain tissue from AD patients and control subjects.
en-28-376-s004.pdfFigures
Tables
*Raw p<0.05 and pathway impact >0.05 was used as cutoff value.
References
- Alzheimer's Association. 2016 Alzheimer's disease facts and figures. Alzheimers Dement 2016;12:459-509.

- Prince M, Comas-Herrera A, Knapp M, Guerchet M, Karagiannidou M. World Alzheimer report 2016. Improving healthcare for people living with dementia: coverage, quality and costs now and in the future. London: Alzheimer's Disease International, 2016.
- Reitz C, Brayne C, Mayeux R. Epidemiology of Alzheimer disease. Nat Rev Neurol 2011;7:137-152.
- Albers DS, Beal MF. Mitochondrial dysfunction and oxidative stress in aging and neurodegenerative disease. J Neural Transm Suppl 2000;59:133-154.
- Blennow K, de Leon MJ, Zetterberg H. Alzheimer's disease. Lancet 2006;368:387-403.
- González-Domínguez R, García-Barrera T, Gómez-Ariza JL. Characterization of metal profiles in serum during the progression of Alzheimer's disease. Metallomics 2014;6:292-300.
- Smith MA, Rottkamp CA, Nunomura A, Raina AK, Perry G. Oxidative stress in Alzheimer's disease. Biochim Biophys Acta 2000;1502:139-144.
- Tuppo EE, Arias HR. The role of inflammation in Alzheimer's disease. Int J Biochem Cell Biol 2005;37:289-305.
- Monge-Argilés JA, Muñoz-Ruiz C, Pampliega-Pérez A, Gómez-López MJ, Sánchez-Payá J, Rodríguez Borja E, Ruiz-Vegara M, Montoya-Gutiérrez FJ, Leiva-Santana C. Biomarkers of Alzheimer's disease in the cerebrospinal fluid of Spanish patients with mild cognitive impairment. Neurochem Res 2011;36:986-993.
- Inoue K, Tsutsui H, Akatsu H, Hashizume Y, Matsukawa N, Yamamoto T, Toyo'oka T. Metabolic profiling of Alzheimer's disease brains. Sci Rep 2013;3:2364.
- Wishart DS, Tzur D, Knox C, Eisner R, Guo AC, Young N, Cheng D, Jewell K, Arndt D, Sawhney S, Fung C, Nikolai L, Lewis M, Coutouly MA, Forsythe I, Tang P, Shrivastava S, Jeroncic K, Stothard P, Amegbey G, Block D, Hau DD, Wagner J, Miniaci J, Clements M, Gebremedhin M, Guo N, Zhang Y, Duggan GE, Macinnis GD, Weljie AM, Dowlatabadi R, Bamforth F, Clive D, Greiner R, Li L, Marrie T, Sykes BD, Vogel HJ, Querengesser L. HMDB: the Human Metabolome Database. Nucleic Acids Res 2007;35:D521-D526.
- Sévin DC, Kuehne A, Zamboni N, Sauer U. Biological insights through nontargeted metabolomics. Curr Opin Biotechnol 2015;34:1-8.
- Graham SF, Chevallier OP, Roberts D, Hölscher C, Elliott CT, Green BD. Investigation of the human brain metabolome to identify potential markers for early diagnosis and therapeutic targets of Alzheimer's disease. Anal Chem 2013;85:1803-1811.
- Enche Ady CN, Lim SM, Teh LK, Salleh MZ, Chin AV, Tan MP, Poi PJ, Kamaruzzaman SB, Abdul Majeed AB, Ramasamy K. Metabolomic-guided discovery of Alzheimer's disease biomarkers from body fluid. J Neurosci Res 2017;95:2005-2024.
- Snowden SG, Ebshiana AA, Hye A, An Y, Pletnikova O, O'Brien R, Troncoso J, Legido-Quigley C, Thambisetty M. Association between fatty acid metabolism in the brain and Alzheimer disease neuropathology and cognitive performance: a nontargeted metabolomic study. PLoS Med 2017;14:e1002266.
- Ibáñez C, Simó C, Cifuentes A. Metabolomics in Alzheimer's disease research. Electrophoresis 2013;34:2799-2811.
- Liang Q, Liu H, Zhang T, Jiang Y, Xing H, Zhang A. Discovery of serum metabolites for diagnosis of progression of mild cognitive impairment to Alzheimer's disease using an optimized metabolomics method. RSC Advances 2016;6:3586-3591.
- Huang Q, Tan Y, Yin P, Ye G, Gao P, Lu X, Wang H, Xu G. Metabolic characterization of hepatocellular carcinoma using nontargeted tissue metabolomics. Cancer Res 2013;73:4992-5002.
- Wang H, Xu J, Chen Y, Zhang R, He J, Wang Z, Zang Q, Wei J, Song X, Abliz Z. Optimization and evaluation strategy of esophageal tissue preparation protocols for metabolomics by LC-MS. Anal Chem 2016;88:3459-3464.
- Lee J, Kim Y, Liu T, Hwang YJ, Hyeon SJ, Im H, Lee K, Alvarez VE, McKee AC, Um SJ, Hur M, Mook-Jung I, Kowall NW, Ryu H. SIRT3 deregulation is linked to mitochondrial dysfunction in Alzheimer's disease. Aging Cell 2018;17:e12679.
- van den Berg RA, Hoefsloot HC, Westerhuis JA, Smilde AK, van der Werf MJ. Centering, scaling, and transformations: improving the biological information content of metabolomics data. BMC Genomics 2006;7:142.
- Barupal DK, Haldiya PK, Wohlgemuth G, Kind T, Kothari SL, Pinkerton KE, Fiehn O. MetaMapp: mapping and visualizing metabolomic data by integrating information from biochemical pathways and chemical and mass spectral similarity. BMC Bioinformatics 2012;13:99.
- Shannon P, Markiel A, Ozier O, Baliga NS, Wang JT, Ramage D, Amin N, Schwikowski B, Ideker T. Cytoscape: a software environment for integrated models of biomolecular interaction networks. Genome Res 2003;13:2498-2504.
- Suhre K, Schmitt-Kopplin P. MassTRIX: mass translator into pathways. Nucleic Acids Res 2008;36:W481-W484.
- Kanehisa M, Furumichi M, Tanabe M, Sato Y, Morishima K. KEGG: new perspectives on genomes, pathways, diseases and drugs. Nucleic Acids Res 2017;45:D353-D361.
- Grapov D, Wanichthanarak K, Fiehn O. MetaMapR: pathway independent metabolomic network analysis incorporating unknowns. Bioinformatics 2015;31:2757-2760.
- Gika HG, Theodoridis GA, Wingate JE, Wilson ID. Within-day reproducibility of an HPLC-MS-based method for metabonomic analysis: application to human urine. J Proteome Res 2007;6:3291-3303.
- Godzien J, Ciborowski M, Angulo S, Barbas C. From numbers to a biological sense: how the strategy chosen for metabolomics data treatment may affect final results. A practical example based on urine fingerprints obtained by LC-MS. Electrophoresis 2013;34:2812-2826.
- Sangster T, Major H, Plumb R, Wilson AJ, Wilson ID. A pragmatic and readily implemented quality control strategy for HPLC-MS and GC-MS-based metabonomic analysis. Analyst 2006;131:1075-1078.
- Boccard J, Rutledge DN. A consensus orthogonal partial least squares discriminant analysis (OPLS-DA) strategy for multiblock Omics data fusion. Anal Chim Acta 2013;769:30-39.
- Bylesjö M, Rantalainen M, Cloarec O, Nicholson JK, Holmes E, Trygg J. OPLS discriminant analysis: combining the strengths of PLS-DA and SIMCA classification. J Chemom 2006;20:341-351.
- Xia J, Sinelnikov IV, Han B, Wishart DS. MetaboAnalyst 3.0--making metabolomics more meaningful. Nucleic Acids Res 2015;43:W251-W257.
- Wang Y, Bryant SH, Cheng T, Wang J, Gindulyte A, Shoemaker BA, Thiessen PA, He S, Zhang J. PubChem BioAssay: 2017 update. Nucleic Acids Res 2017;45:D955-D963.
- Ross AJ, Sachdev PS. Magnetic resonance spectroscopy in cognitive research. Brain Res Brain Res Rev 2004;44:83-102.
- Moffett JR, Ross B, Arun P, Madhavarao CN, Namboodiri AM. N-Acetylaspartate in the CNS: from neurodiagnostics to neurobiology. Prog Neurobiol 2007;81:89-131.
- Clark JF, Doepke A, Filosa JA, Wardle RL, Lu A, Meeker TJ, Pyne-Geithman GJ. N-acetylaspartate as a reservoir for glutamate. Med Hypotheses 2006;67:506-512.
- Zhou Y, Danbolt NC. Glutamate as a neurotransmitter in the healthy brain. J Neural Transm (Vienna) 2014;121:799-817.
- Wang G, Zhou Y, Huang FJ, Tang HD, Xu XH, Liu JJ, Wang Y, Deng YL, Ren RJ, Xu W, Ma JF, Zhang YN, Zhao AH, Chen SD, Jia W. Plasma metabolite profiles of Alzheimer's disease and mild cognitive impairment. J Proteome Res 2014;13:2649-2658.
- Gueli MC, Taibi G. Alzheimer's disease: amino acid levels and brain metabolic status. Neurol Sci 2013;34:1575-1579.
- Dedeoglu A, Choi JK, Cormier K, Kowall NW, Jenkins BG. Magnetic resonance spectroscopic analysis of Alzheimer's disease mouse brain that express mutant human APP shows altered neurochemical profile. Brain Res 2004;1012:60-65.
- Lalande J, Halley H, Balayssac S, Gilard V, Déjean S, Martino R, Francés B, Lassalle JM, Malet-Martino M. 1H NMR metabolomic signatures in five brain regions of the AβPPswe Tg2576 mouse model of Alzheimer's disease at four ages. J Alzheimers Dis 2014;39:121-143.
- Salek RM, Xia J, Innes A, Sweatman BC, Adalbert R, Randle S, McGowan E, Emson PC, Griffin JL. A metabolomic study of the CRND8 transgenic mouse model of Alzheimer's disease. Neurochem Int 2010;56:937-947.
- Forster DM, James MF, Williams SR. Effects of Alzheimer's disease transgenes on neurochemical expression in the mouse brain determined by 1H MRS
in vitro . NMR Biomed 2012;25:52-58.
- Reyes-Haro D, Cabrera-Ruíz E, Estrada-Mondragón A, Miledi R, Martínez-Torres A. Modulation of GABA-A receptors of astrocytes and STC-1 cells by taurine structural analogs. Amino Acids 2014;46:2587-2593.
- Oh SM, Bhattarai JP, Han SK, Park SJ. Effects of hypotaurine on substantia gelatinosa neurons of the trigeminal subnucleus caudalis in immature mice. Amino Acids 2016;48:2843-2853.
- Dominy J, Thinschmidt JS, Peris J, Dawson R, Papke RL. Taurine-induced long-lasting potentiation in the rat hippocampus shows a partial dissociation from total hippocampal taurine content and independence from activation of known taurine transporters. J Neurochem 2004;89:1195-1205.
- Leon R, Wu H, Jin Y, Wei J, Buddhala C, Prentice H, Wu JY. Protective function of taurine in glutamate-induced apoptosis in cultured neurons. J Neurosci Res 2009;87:1185-1194.
- El Idrissi A, Messing J, Scalia J, Trenkner E. Prevention of epileptic seizures by taurine. Adv Exp Med Biol 2003;526:515-525.
- Olive MF. Interactions between taurine and ethanol in the central nervous system. Amino Acids 2002;23:345-357.
- Gao P, Yang C, Nesvick CL, Feldman MJ, Sizdahkhani S, Liu H, Chu H, Yang F, Tang L, Tian J, Zhao S, Li G, Heiss JD, Liu Y, Zhuang Z, Xu G. Hypotaurine evokes a malignant phenotype in glioma through aberrant hypoxic signaling. Oncotarget 2016;7:15200-15214.
- McNeill LA, Hewitson KS, Gleadle JM, Horsfall LE, Oldham NJ, Maxwell PH, Pugh CW, Ratcliffe PJ, Schofield CJ. The use of dioxygen by HIF prolyl hydroxylase (PHD1). Bioorg Med Chem Lett 2002;12:1547-1550.
- Gos T, Hauser R, Krzyzanowski M. The post-mortem concentration of glutamate in the structures of rat brain as an exponent of short aversive sensory stimulation preceding death. Forensic Sci Int 2001;123:130-134.
- Gonzalez-Riano C, Tapia-González S, García A, Muñoz A, DeFelipe J, Barbas C. Metabolomics and neuroanatomical evaluation of post-mortem changes in the hippocampus. Brain Struct Funct 2017;222:2831-2853.
- Paglia G, Stocchero M, Cacciatore S, Lai S, Angel P, Alam MT, Keller M, Ralser M, Astarita G. Unbiased metabolomic investigation of Alzheimer's disease brain points to dysregulation of mitochondrial aspartate metabolism. J Proteome Res 2016;15:608-618.
- Graham SF, Holscher C, Green BD. Metabolic signatures of human Alzheimer's disease (AD): 1H NMR analysis of the polar metabolome of post-mortem brain tissue. Metabolomics 2014;10:744-753.
- Ivanisevic J, Epstein AA, Kurczy ME, Benton PH, Uritboonthai W, Fox HS, Boska MD, Gendelman HE, Siuzdak G. Brain region mapping using global metabolomics. Chem Biol 2014;21:1575-1584.
- Zhao Y, Fu L, Li R, Wang LN, Yang Y, Liu NN, Zhang CM, Wang Y, Liu P, Tu BB, Zhang X, Qiao J. Metabolic profiles characterizing different phenotypes of polycystic ovary syndrome: plasma metabolomics analysis. BMC Med 2012;10:153.
- Griffin JW, Bradshaw PC. Amino acid catabolism in Alzheimer's disease brain: friend or foe?. Oxid Med Cell Longev 2017;2017:5472792.
- Rist MJ, Roth A, Frommherz L, Weinert CH, Krüger R, Merz B, Bunzel D, Mack C, Egert B, Bub A, Görling B, Tzvetkova P, Luy B, Hoffmann I, Kulling SE, Watzl B. Metabolite patterns predicting sex and age in participants of the Karlsruhe Metabolomics and Nutrition (KarMeN) study. PLoS One 2017;12:e0183228.
- Darst BF, Koscik RL, Hogan KJ, Johnson SC, Engelman CD. Longitudinal plasma metabolomics of aging and sex. Aging (Albany NY) 2019;11:1262-1282.