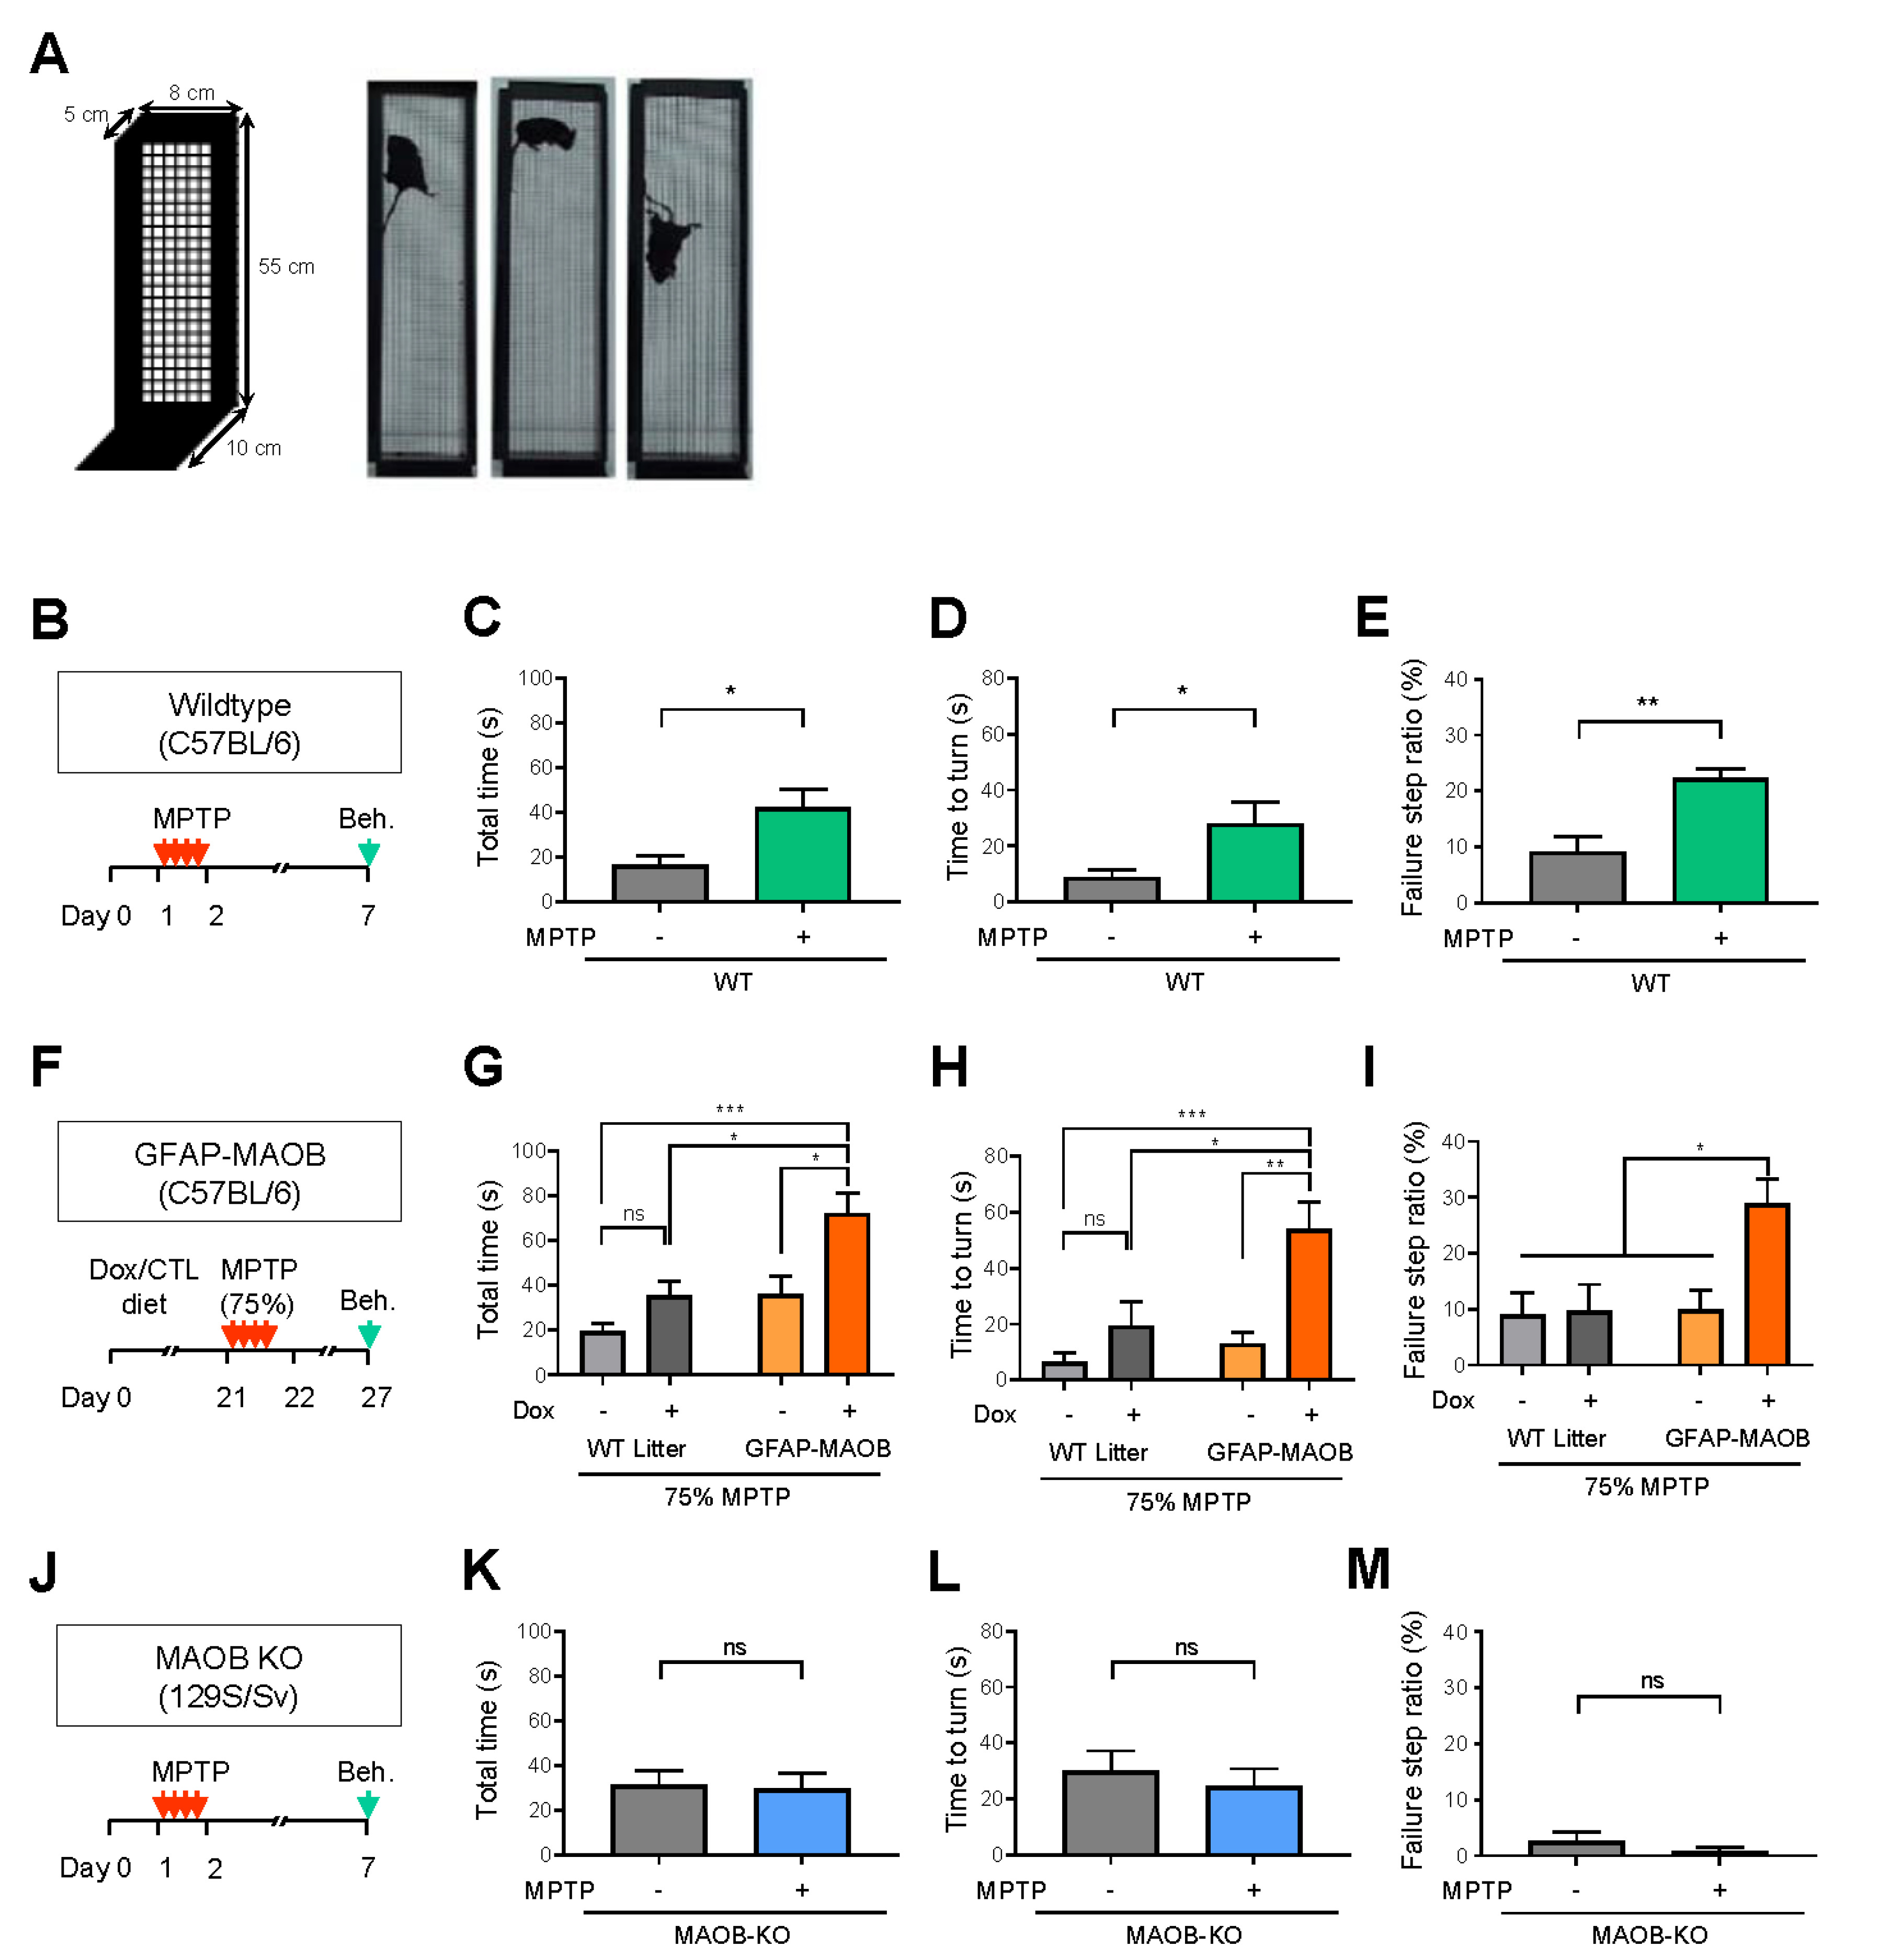
Fig. 3. Astrocytic MAOB is responsible for MPTP-induced parkinsonian motor symptoms. (A) Schematic diagram of vertical grid test. (B) Experimental schedule of vertical grid test after MPTP- or vehicle-treatment in WT mice. (C-E) Quantification of total time, time to turn, and failure step ratio (N=6 mice for each group). (F) Experimental schedule of vertical grid test for GFAP-MAOB transgenic mice treated with 75% dose of MPTP. (G-I) Quantification of total time, time to turn, and failure step ratio (N=5, 4, 6, and 6 mice for each group). (J) Experimental schedule of vertical grid test after MPTP- or vehicle-treatment in MAOB-KO mice. (K-M) Quantification of total time, time to turn, and failure step ratio (N=6 mice for each group). For all figures, mean ± SEM; ns, non-significance; *p<0.05, **p<0.01, ***p<0.001 assessed by Student’s t-test (C~E, K~M) or two-way ANOVA with Tukey (G~I).
© Exp Neurobiol