Download original image
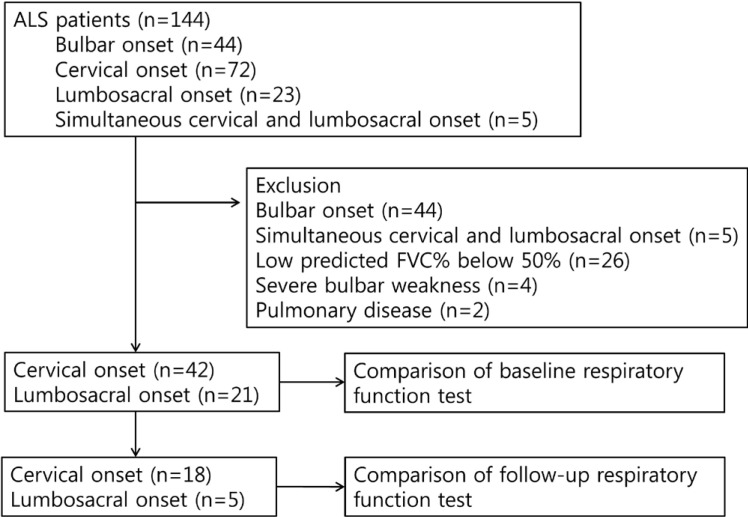
Fig. 1.
Flow chart of this study.
Exp Neurobiol 2015;24:351~357
https://doi.org/10.5607/en.2015.24.4.351
© Exp Neurobiol
© 2019.
The Korean Society for Brain and Neural Sciences
. / Powered by
INFOrang Co., Ltd