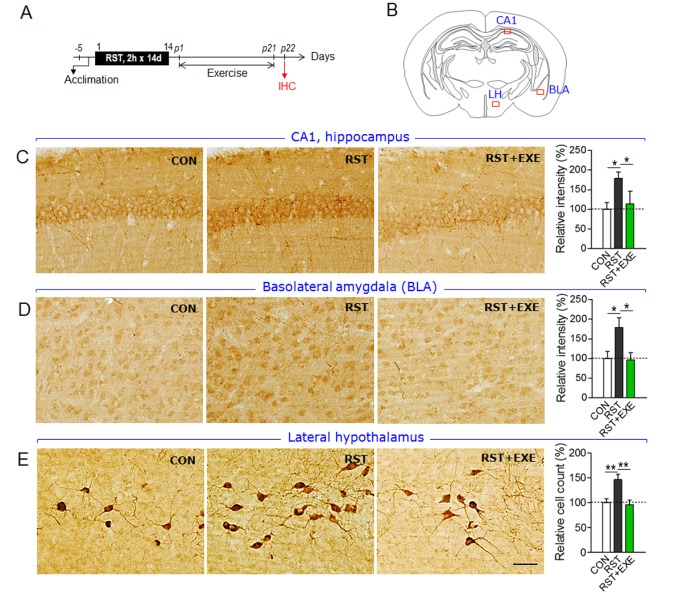
Fig. 4CRepeated restrant stress upregulated the expression of MCH in the brain, while exercise reversed the increased expression of MCH. (A) Experimental design for treatment with 2 h×14 d RST and post-stress treatment with wheel-running exercise, and time point for tissue preparation (arrow). Wheel-running exercise was treated for 1 h daily from post-stress days 1~21. (B) Brain regions marked by rectangles were used for analysis of MCH expression and for the high magnifications in ~E. CA1, CA1 of the hippocampus; BLA, basolateral amygdala; LH, lateral hypothalamus. (C~E) Photomicrographs showing the expression of MCH in the CA1 of the hippocampus (C), basolateral amygdala (BLA) (D), and lateral hypothalamus (LH) (E) of control animals (CON), mice treated with 2 h×14 d RST (RST), and mice treated with 2 h×14 d RST followed by exercise (RST+EXE). The quantified levels of MCH in the CA1 (C), BLA (D), and LH (E) are represented with bar graphs to the right of the photomicrographs. Scale bar; 200 µm. Data are presented as mean±SEM (n=10~24). * and **, p<0.05 and p<0.01, respectively, for the differences between the control and indicated groups (one-way ANOVA and Newman-Keuls post hoc test).
© Exp Neurobiol