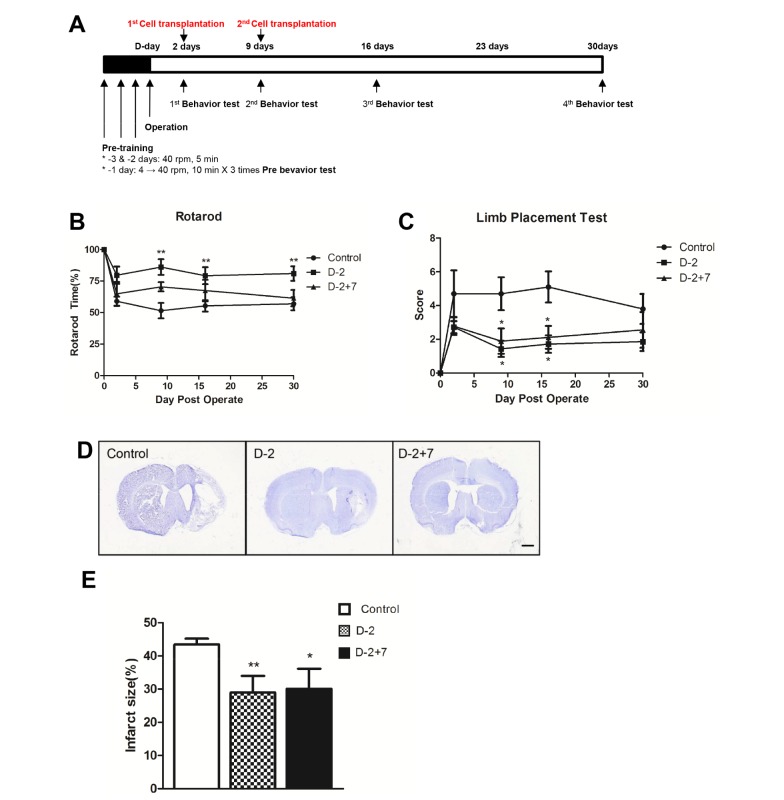
Fig. 1. Infarct size and behavioral outcomes in response to single and repeated treatment of hUCB-MSCs after MCAO. (A) Schematic of the time schedule. (B) Rotarod test. (C) Limb placement test (LPT). Data are means±SEM. control (n=11) vs D-2 (n=7) vs D-2+7 (n=5) group. (D) Infarct size in rats that received one or repeated hUCB-MSC treatment. Representative cresyl violet staining images (control group, left; one treat group, middle; repeat group, right). (E) Data are mean percentage of the infarct size±SEM, relative to the size of the intact hemisphere. *p<0.05, **p<0.01, control, D-2 and D-2+7 groups. Scale bar=1,000 µm.
© Exp Neurobiol