Download original image
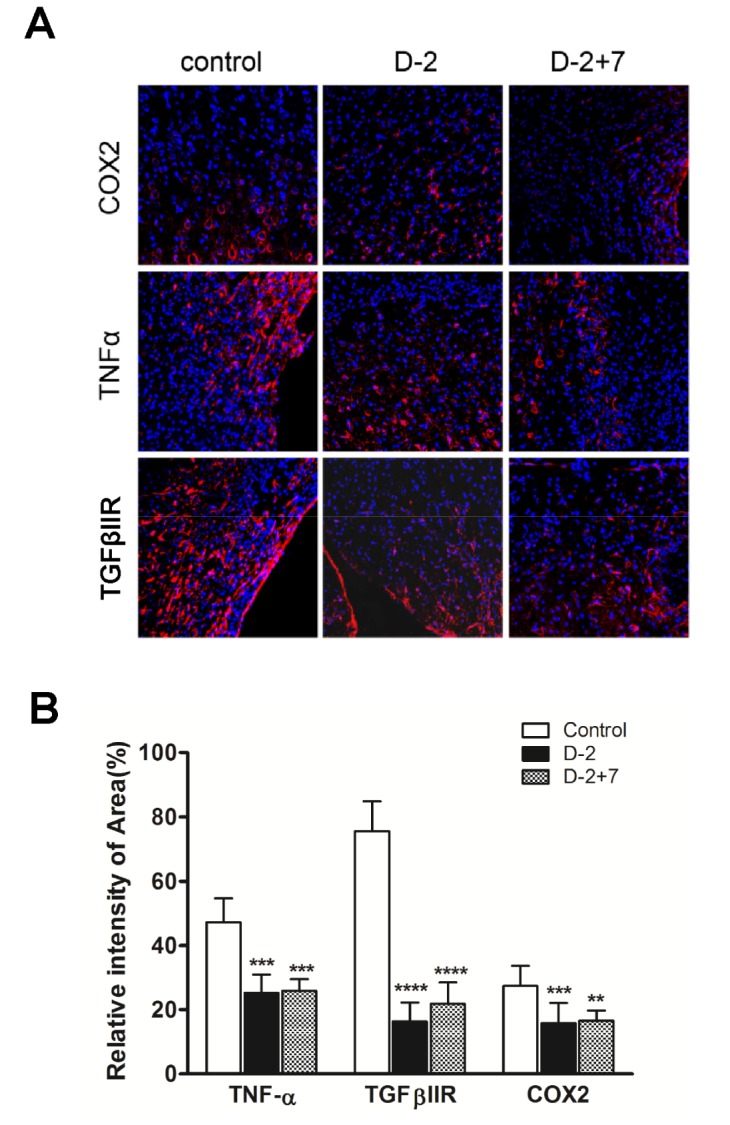
Fig. 4.
Neuro-inflammation in the ischemic brain. (A, B) TNF-α, TGFβIIR and COX2 immunostaining (A) and quantification (B) in the IBZ of control, D-2 and D-2+7 groups.
**
p<0.01, control, D-2 and D-2+7 groups. Scale bars=20 µm.
Exp Neurobiol 2017;26:55~65
https://doi.org/10.5607/en.2017.26.1.55
© Exp Neurobiol
© 2019.
The Korean Society for Brain and Neural Sciences
. / Powered by
INFOrang Co., Ltd