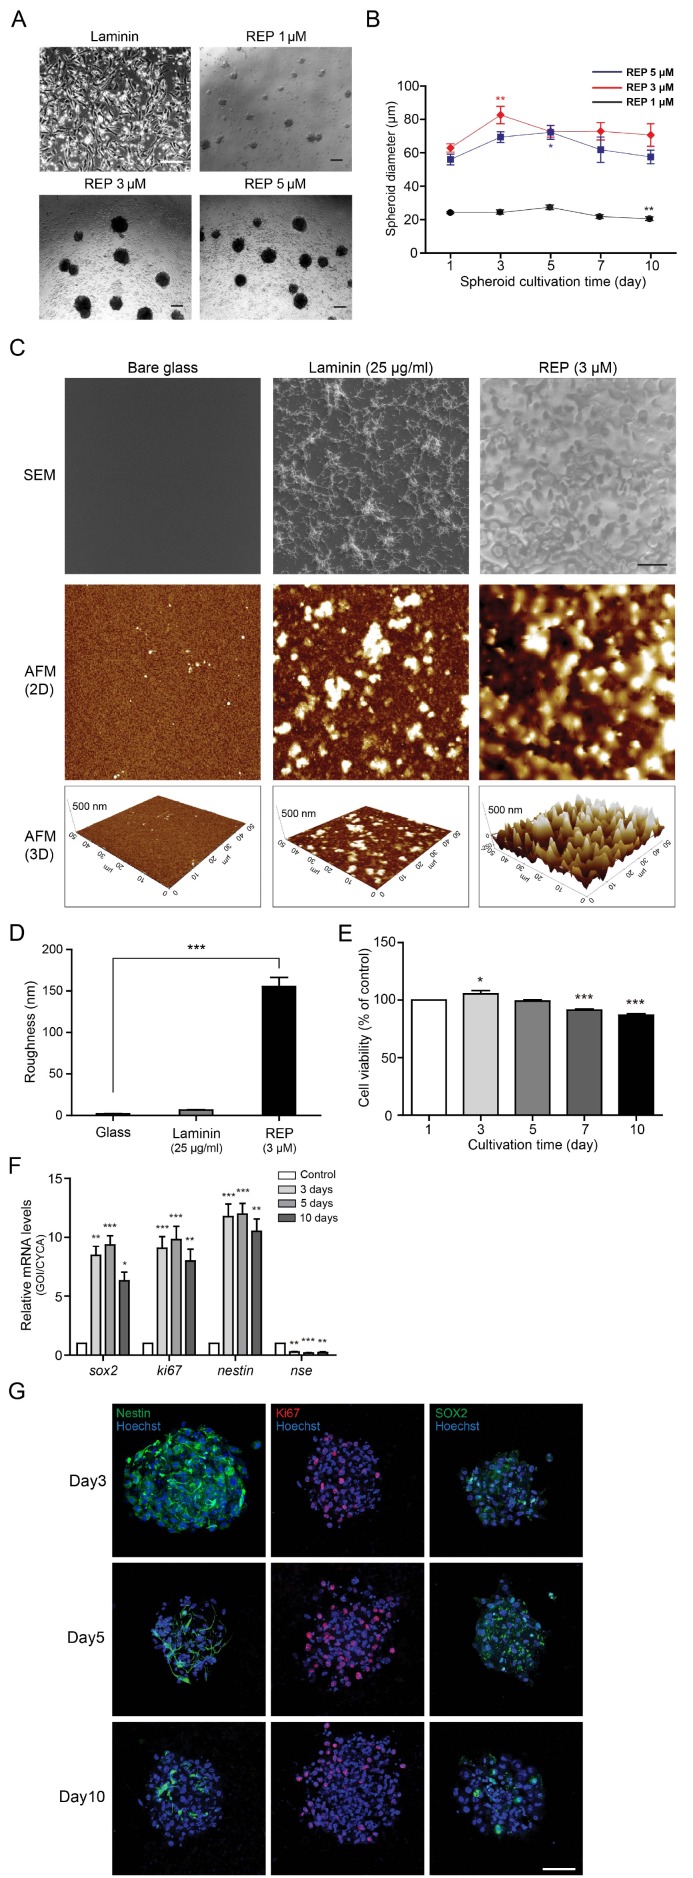
Fig. 1. Generation and verification of ORN precursor spheroids. (A) Phase contrast microscopic images of ORN precursors plated on laminin and REP-pretreated plates for 24 hours. 1×10⁵ cells/ml and 1×10⁶ cells/ml primary cultured ORN precursors were plated on 1 µM, 3 µM, 5 µM of ELP. Scale bar=100 µm. (B) Cultivation time-dependent changes in the diameter of spheroids (1 µM : n=59 in day 1, n=53 in day 3, n=51 in day 5, n=45 in day 7, n=46 in day 10, 3 µM : n=58 in day 1, n=58 in day 3, n=60 in day 5, n=53 in day 7, n=54 in day 10, 5 µM : n=50 in day 1, n=58 in day 3, n=51 in day 5, n=51 in day 7, n=39 in day 10). *<0.05, **<0.01, ***<0.001. (C) SEM and AFM images of bare glass, 3 µM REP coated cover glass, and 25 µg/ml laminin coated cover glass. Magnification of SEM images is 1000× and scale bar is 50 µm. (D) Roughness of bare glass, 25 µg/ml laminin, and 3 µM REP (***<0.001). (E) Cultivation time dependent cell viability of ORN precursor spheroids formed on 3 µM REP-coated plate (n=6, *<0.05, ***<0.001). (F) Comparison of expression levels of stemness markers in the control and ORN spheroid groups. Control group is ORNs plated on the laminin-coated plate for 72 hours and other groups are ORNs plated on the REP-coated for three, five, and ten days. (G) Immunocytochemistry images of stem cell related markers in the ORN spheroids. Scale bar is 50 µm. Data were obtained from three separate animal culture experiments.
© Exp Neurobiol