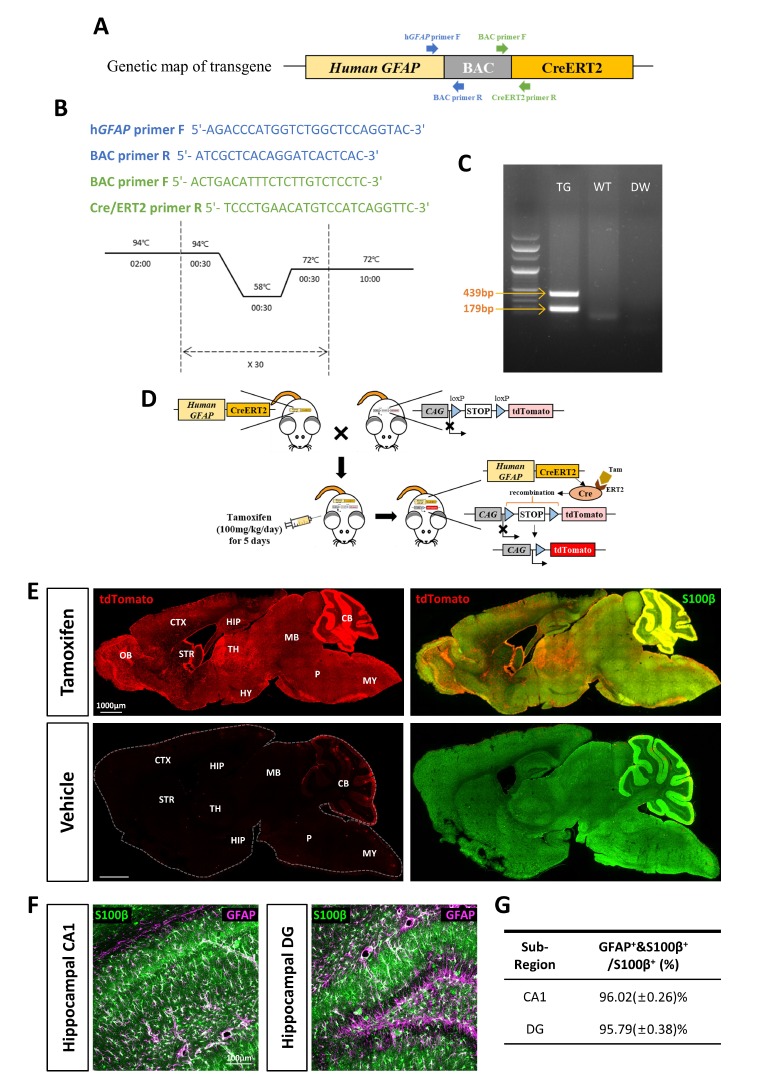
Fig. 1. Genetic confimation of hGFAP-CreERT2 mouse line and its tamoxifen inducible Cre expression. (A) Genetic map of hGFAP-CreERT2. (B) The primer sequences and PCR protocol of hGFAP-CreERT2 transgenic mice. (C) PCR results of genotyping; TG: Transgenic mouse, WT: Wild-Type, DW: ddH2O (D) Schematic diagram of generation of double transgenic mouse. (E) Sagittal brain section images from tamoxifen or vehicle (sunflower oil) treated hGFAP-CreERT2 mouse. Red fluorescence indicates tdTomato, and green fluorescence indicates S100β. OB=Olfactory bulb, CTX=Cortex, STR=Striatum, HIP=Hippocampus, TH=thalamus, HY=Hypothalamus, CB=Cerebellum, MB=Midbrain, P=Pons, and MY=Medulla. (F) S100β and GFAP localization images of hippocampal CA1 layer (CA1, left) and dentate gyrus (DG, middle). Green fluorescence indicates S100β, and magenta fluorescence indicates GFAP. (G) Summary table of co-localization ratio of S100β+ & GFAP+ cells among S100β+ cells in each images, (CA1: n=4 sections, DG: n=2 sections from 2 mice) (Mean±SEM).
© Exp Neurobiol